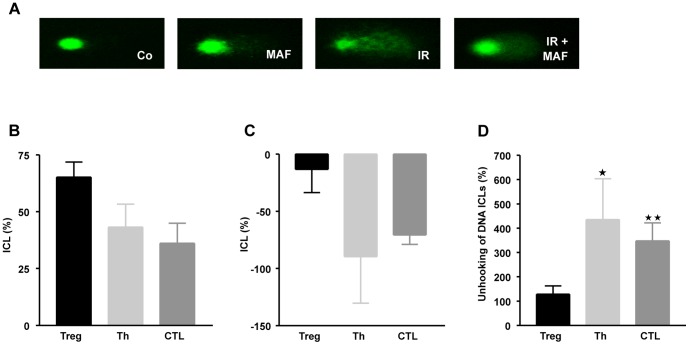
Figure 6. Crosslink induction and repair in Treg, Th and CTL.
A, Representative comets of cells not treated (control), mafosfamide (20 µg/ml) treated, gamma-ray treated (IR, 8 Gy) and IR plus mafosfamide treated. B, Quantification. ICL (%) was defined as decrease in tail moment as described in material and methods, 4 h after treatment. C, ICL (%) 24 h after treatment. D, Relative repair of ICL, which is given by the relative ICL level 24 h after treatment in relation to the level 4 h after treatment. Data are the mean of at least three independent experiments. * p<0.05; **p<0.01 significance.

