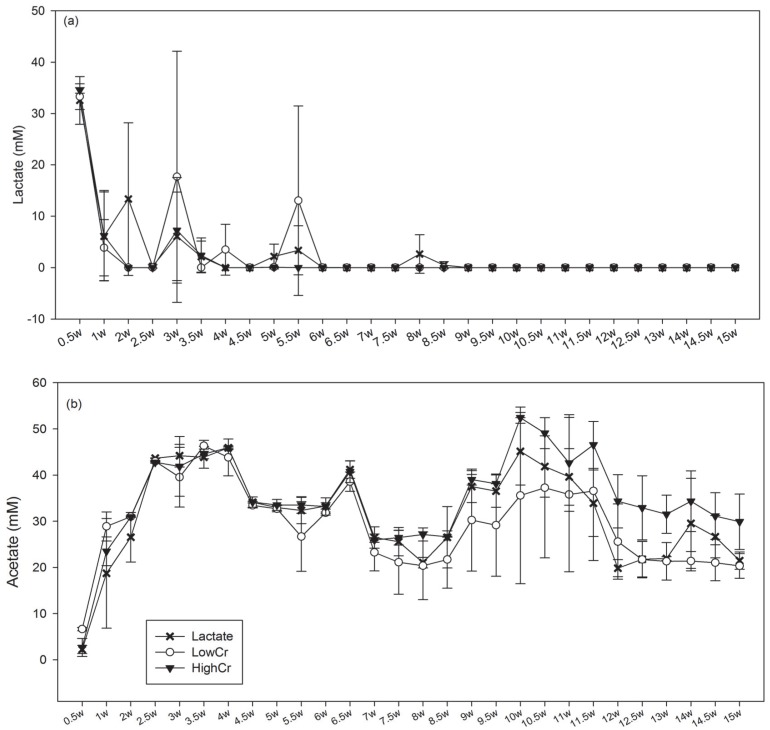
Figure 2. Averaged metabolite concentrations in duplicate bioreactors inoculated with Hanford well H-100 groundwater.
(a) Lactate and (b) Acetate concentrations when amended with (X) 0 mg/L Cr(VI), (○) 0.1 mg/L Cr(VI) and (▾) 3.0 mg/L Cr(VI). W = weeks. Error bars indicate 1 standard deviation between replicates.

