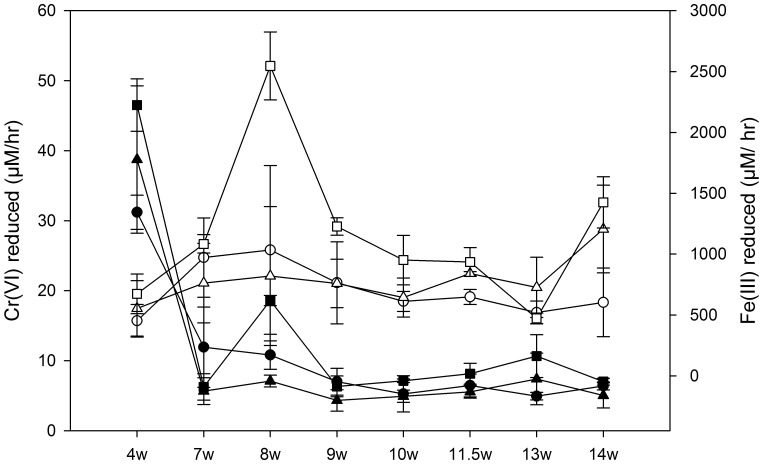
Figure 4. Quantification of metal-reduction capacities of the bioreactor microbial communities over time.
Averaged chromium (closed) and soluble iron (open) reduced after twelve hour incubations of washed cells from the duplicate bioreactors inoculated with Hanford well H-100 groundwater amended with (circle) 0.0 mg/L Cr(VI), (triangle) 0.1 mg/L Cr(VI) and (square) 3.0 mg/L Cr(VI). Each time point represents the calculated reduction rate for that weeks sampling from the bioreactors. W = weeks. Error bars indicate 1 standard deviation between replicates.

