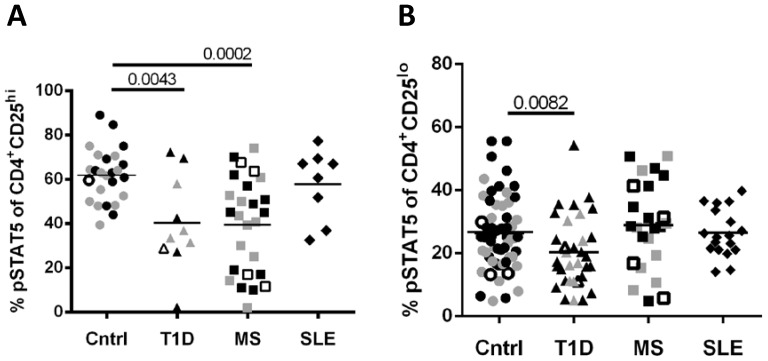
Figure 1. Decreased response to IL-2 in CD4+CD25+ T cells is a phenotype common to T1D and MS, but not SLE subjects.
PBMC were thawed, rested and stimulated with media alone or IL-2 (100 IU/ml) prior to fixation, permeabilization and staining with CD4, CD25, CD45RO and pSTAT5. (A) The frequency of pSTAT5+ cells of CD25hi cells was determined by comparing media to 25 IU IL-2 stimulation for 20min. (B) In an independent cohort, the frequency of pSTAT5+ cells of CD25lo cells was determined by comparing media to 100 IU IL-2 stimulation for 10min. In all experiments, patients and controls were prospectively matched with controls for age and ethnicity. Groups in (A) and (B) differed by multiple parameter testing using a Kruskal-Wallis test with p-values of 0.0008 and 0.0198, respectively. Statistical significance for individual pairings using a Mann-Whitney test are shown. Differences shown in (A) were verified with permutation testing where control vs T1D and control vs MS remained significant (<0.001). For (B), after permutation testing the control vs T1D (0.005), T1D vs MS (0.03) and T1D vs SLE (0.01) pairings remained significant. There was one outlier in the T1D cohort in (B). By ANOVA, age, gender, race, disease status or immune treatment did not significantly contribute to differences in % pSTAT5 for any cohort (therapy and disease status analyses are shown in Figure S3). The mean pSTAT5 response is indicated for each group. IL2RArs2104286 genotype is noted by solid black (A/A), solid grey (A/G) and open (G/G) symbols.

