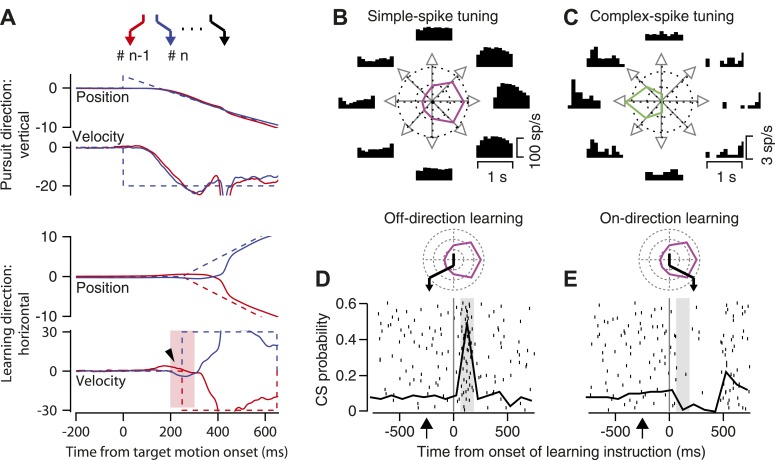
Figure 2. Background information about trial-over-trial learning and the responses of an example floccular Purkinje cell.
(A) The zigzags at the top of the panel show a sequence of target motions in a random-order learning block. From top to bottom, the superimposed traces show vertical position, vertical velocity, horizontal position, and horizontal velocity as a function of time from the onset of target motion. Dashed and solid traces show target and eye movement. Different colored traces show responses in consecutive trials. The arrowhead on the horizontal velocity records points out trial-over-trial learning. The pink shading shows the analysis interval for trial-over-trial learning. (B and C) Direction-tuning of simple-spike (B) and complex-spike (C) responses of an example Purkinje cell. Histograms at eight locations show time varying firing rates for target motion in different directions. Polar plots show tuning-curves. (D and E) Superimposed rasters of CS responses and graphs of the probability of CS responses as a function of time from instruction onset for instructions in the off-direction (D) and on-direction (E) for simple-spike responses. The vertical line shows the time of the instruction onset and the gray shading shows the CS analysis interval. The polar plots above the CS rasters show the direction tuning of the example Purkinje cell in magenta, and use the black zigzag to indicate the trajectory of the learning target motions.

