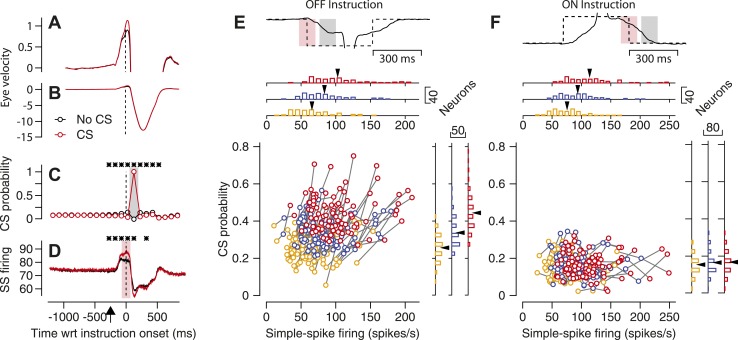
Figure 3. Relationship between simple-spike firing rate and probability of CS responses to an instruction.
(A–D) Average eye velocity along the learning axis (A and B), CS probability (C), and simple-spike firing rate (D) as a function of time in off-direction learning trials. Red and black traces show averages for trials with and without a CS response to the instruction. The same data appear in (A and B), but with high and low gains on the eye velocity axis. Asterisks in (C and D) indicate 100-ms bins when the traces differed significantly (p<0.01, two-tailed paired t-test). Time is relative to the onset of the instruction and the upward arrow in D indicates the time of onset of target motion. (E and F) Neuron-by-neuron analysis for the start of an off-direction instruction (E) and the end of an on-direction instruction (F). The continuous and dashed traces at the top show eye and target velocity along the learning axis. The pink and gray shading show analysis intervals for simple-spike and CS responses. The scatter plot contains three symbols for each Purkinje cell (n = 90); yellow, blue, and red symbols show data for the lowest, middle, and highest third of simple-spike firing rates across trials for each Purkinje cell. Marginal histograms summarize the distributions across the population of Purkinje cells for the three different levels of simple-spike firing rate. Black arrowheads indicate the mean for each distribution.

