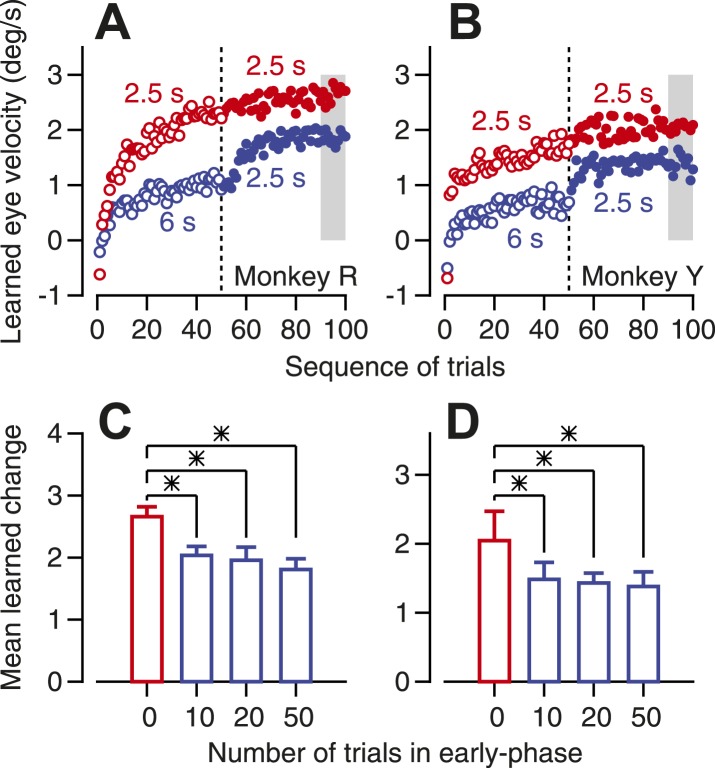
Figure 7. Evidence that past learning inhibits future learning.
(A and B) Eye velocity learning curves for two monkeys. Each symbol shows the average learned eye velocity on a given trial in a sequence of 100 learning trials, averaged across 10 repetitions of the experiment. Red and blue open symbols show data for instruction-test intervals of 2.5 and 6 s in the first 50 trials of the block. Red and blue filled symbols show data for an instruction-test interval of 2.5 s in the second 50 trials of the block after an instruction-test interval of 2.5 and 6 s in the first 50 trials. (C and D) Averages of mean learned eye velocity at the end of a block of 100 learning trials as a function of the number of trials in the early phase with a long instruction-test interval. Asterisks indicate statistically-significant differences (two tailed t-test, p<0.01). The gray shading in A and B indicates the analysis window used for the graphs in C and D.

