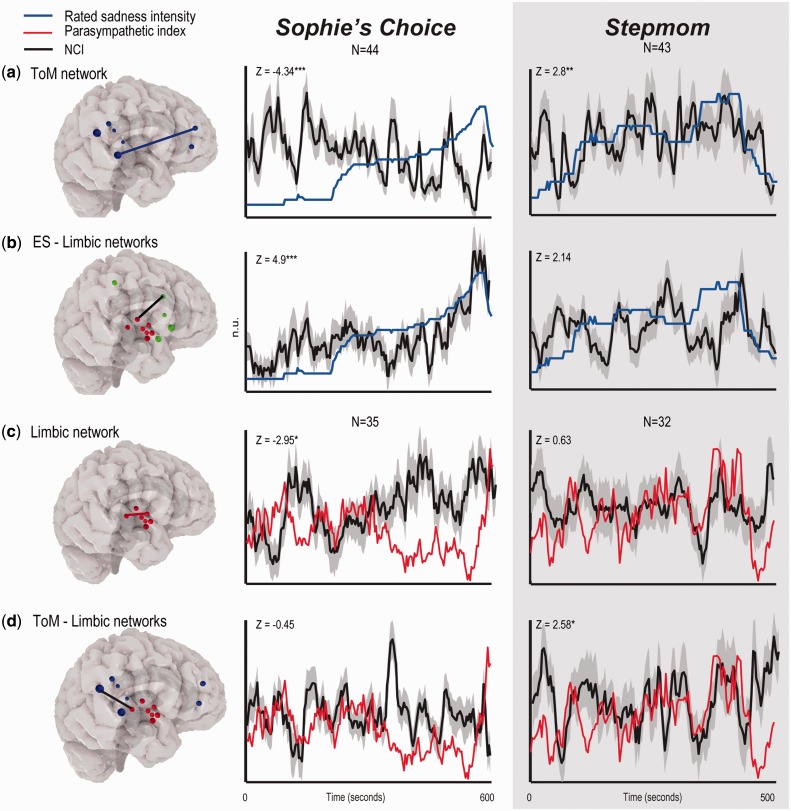
Fig. 3.
Relations between behavioral, physiological and network cohesion indices. Median values of the behavioral index (a,b) and mean values of the physiological (c,d) and network cohesion (a–d) indices are indicated. The gray surface indicates ES-NCI standard error. N = 44 and N = 43 in Sophie and Stepmom, respectively. *P < 0.01, pFDR < 0.04, **P < 0.006, pFDR < 0.03, ***P < 2 × 10⁻⁵, pFDR < 0.001.

