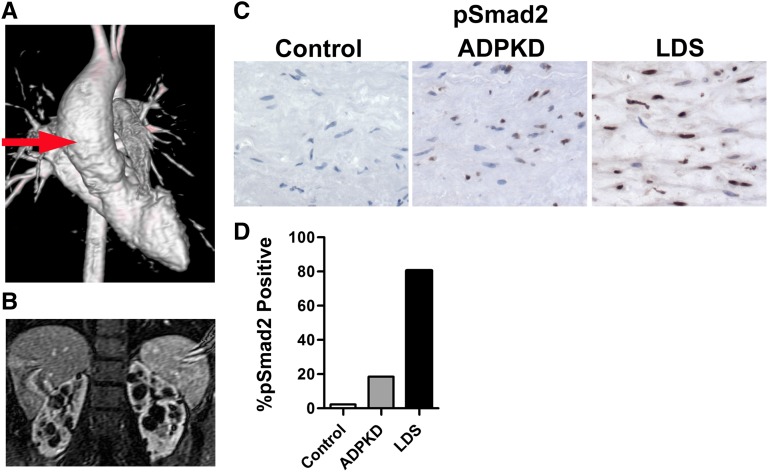
Figure 8.
TGF-β activation in a human ADPKD aortic aneurysm specimen. (A) Three-dimensional magnetic resonance angiogram showing an ascending aortic aneurysm (red arrow) in a 19-year-old patient with ADPKD. (B) Magnetic resonance imaging confirms bilateral cystic kidneys from the same individual. (C) An aortic specimen after resection is stained for pSmad2. This ADPKD aorta shows increased nuclear staining for pSmad2 compared with a control aorta. As a positive control, an aortic sample from a patient with LDS shows intense staining for pSmad2. (D) Quantification of nuclear pSmad2 staining. We analyze 48 fields for each sample that includes 343, 550, and 401 nuclei for control, LDS, and ADPKD aortas, respectively. The total number of nuclei and brown-staining (pSMAD2+) nuclei are counted for each grid area and then summed. The percentage of pSMAD2+ nuclei is determined by dividing brown nuclei by total nuclei.

