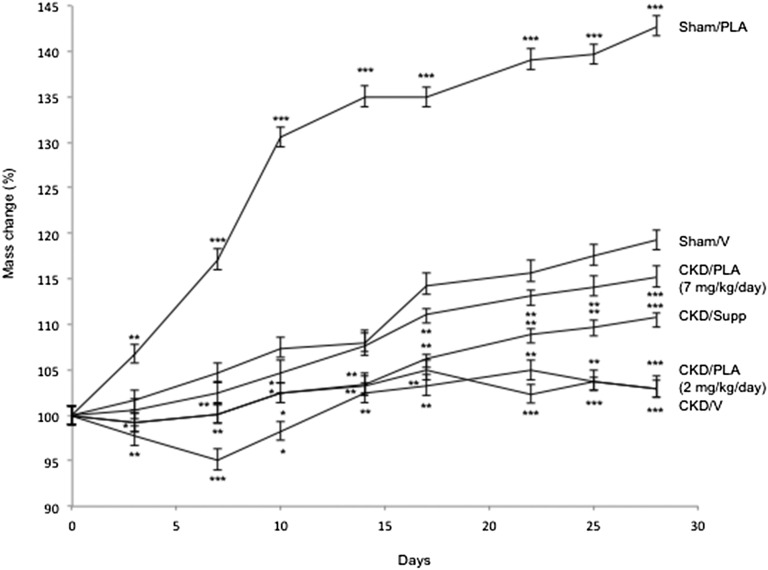
Figure 3.
Weight change during the course of the study. Mice were weighted and normalized with initial weight. Weight changes in CKD/V, CKD/PLA (2 mg/kg per day), CKD/PLA (7 mg/kg per day), CKD/Supp, and Sham/PLA mice were compared with Sham/V mice. Data are expressed as mean ± SEM. *P<0.05; **P<0.01; ***P<0.001.

