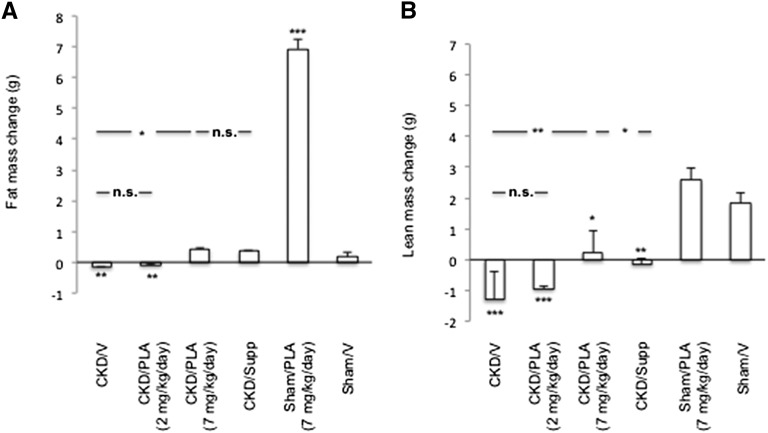
Figure 4.
Change of (A) fat and (B) lean mass in mice. Animals were scanned before the initiation of the study followed 28 days later by a second quantitative magnetic resonance imaging scan. Results were analyzed and expressed as in Figure 3. *P<0.05; **P<0.01; ***P<0.001.

