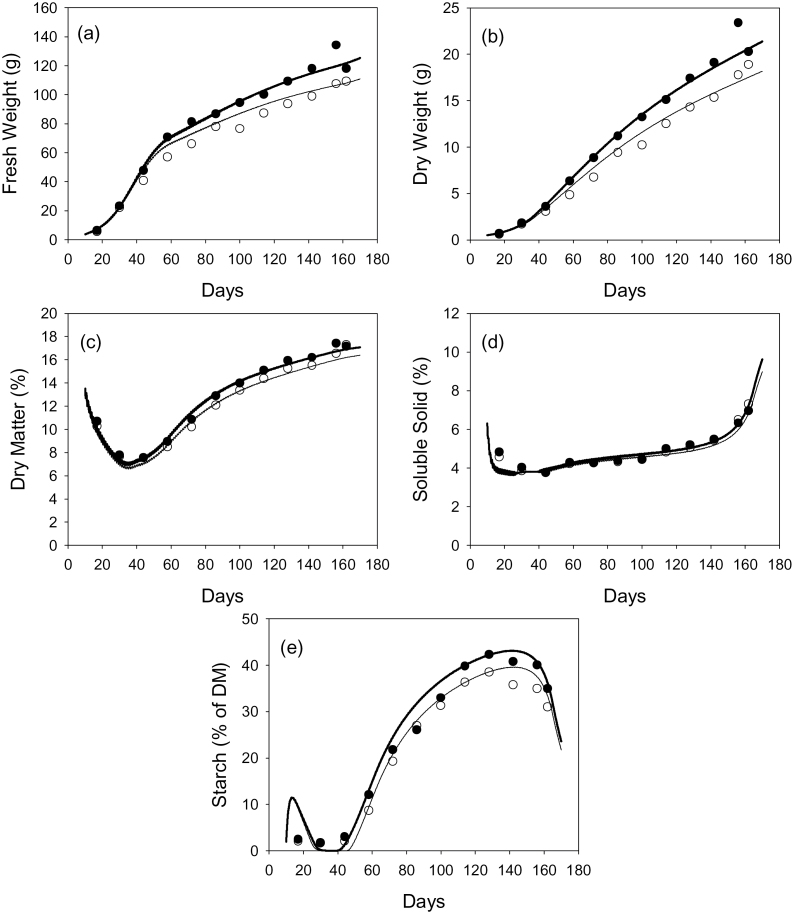
Fig. 3.
Model predictions (lines) and observed values (circles) for the development during the growing season under low (heavy line, filled circles) or high (lighter line, empty circles) crop loads, of fresh weight (a), dry weight (b), percentage of dry matter (c), percentage soluble solids (d), and starch as a percentage of dry matter (e).

