Fig. 6.
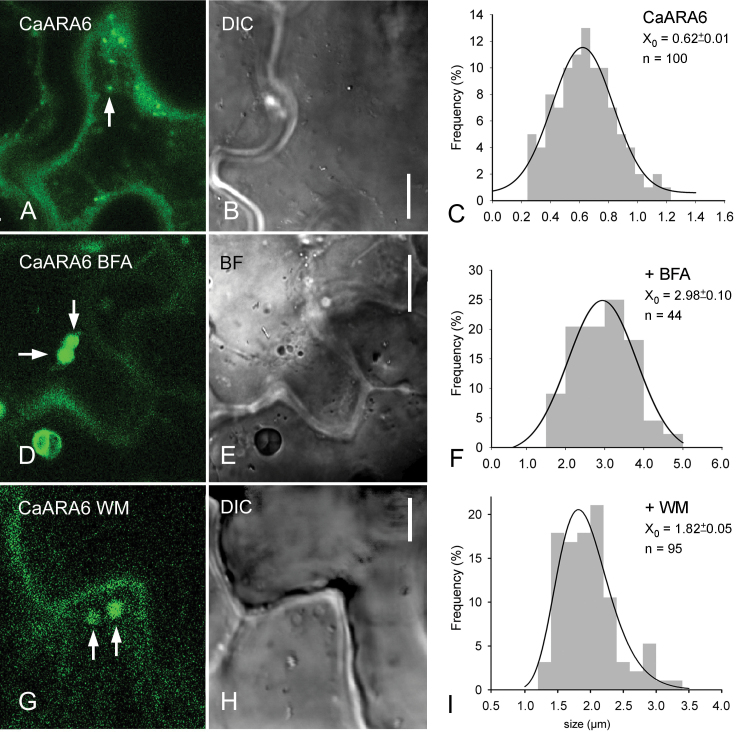
Effect of BFA and WM on CaARA6–GFP transiently expressed in tobacco leaf epidermal cells. (A–C) Untreated control leaf epidermal cell with small punctuate organelles (arrow) (A), differential interference contrast (DIC) image (B) and size–frequency distribution plot (C). (D–F) Leaf infiltrated with 500 µM BFA. Arrows indicate BFA compartments in the fluorescence (D) and in the bright-field (BF) image (E). (F) is the size–frequency distribution of fluorescent organelles. (G–I) Leaf infiltrated with 200 µM WM. Arrows indicate WM compartments in the fluorescence image (G) and in the DIC image (H). (I) is the size–frequency distribution of fluorescent organelles. Bars, 10 µm (A, B, D, E); 5 µm (G, H). (This figure is available in colour at JXB online.)

