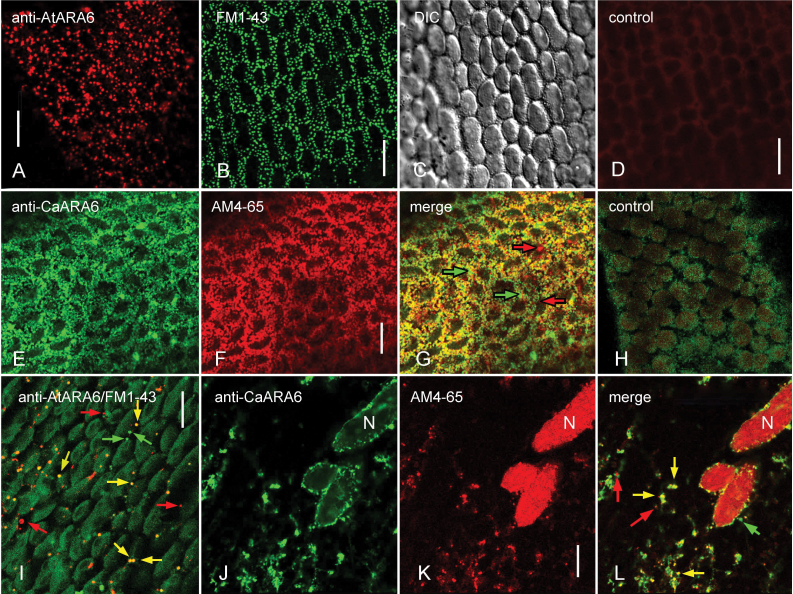
Fig. 8.
ARA6 immunofluorescence in internodal cells of C. australis in comparison with the staining pattern of endocytic tracers. (A–C) Punctuate pattern in the cortex obtained by immunofluorescence with antibody against AtARA6 (A) and by in vivo FM1-43-staining (B; C is the corresponding DIC image). (D) Immunofluorescence without primary antibody (negative control for A). (E–G) ARA6 epitope visualized by immunofluorescence with an antibody against CaARA6 (E) present at charasomes stained with AM4-65 before immunolabelling (F; G is the merged image). (H) Immunofluorescence without primary antibody (negative control for E) and autofluorescence of chloroplasts. (I) Endoplasmic organelles visualized by immunofluorescence with anti-AtARA6 (red fluorescent) and by staining with FM1-43 (green fluorescent). (J–L) Endoplasmic organelles visualized by immunofluorescence with anti-CaARA6 (J) and with AM4-65 (K; L is the merged image). N, nucleus. Yellow arrows indicate co-localizations, red and green arrows indicate non-overlapping structures. Bars, 10 µm.

