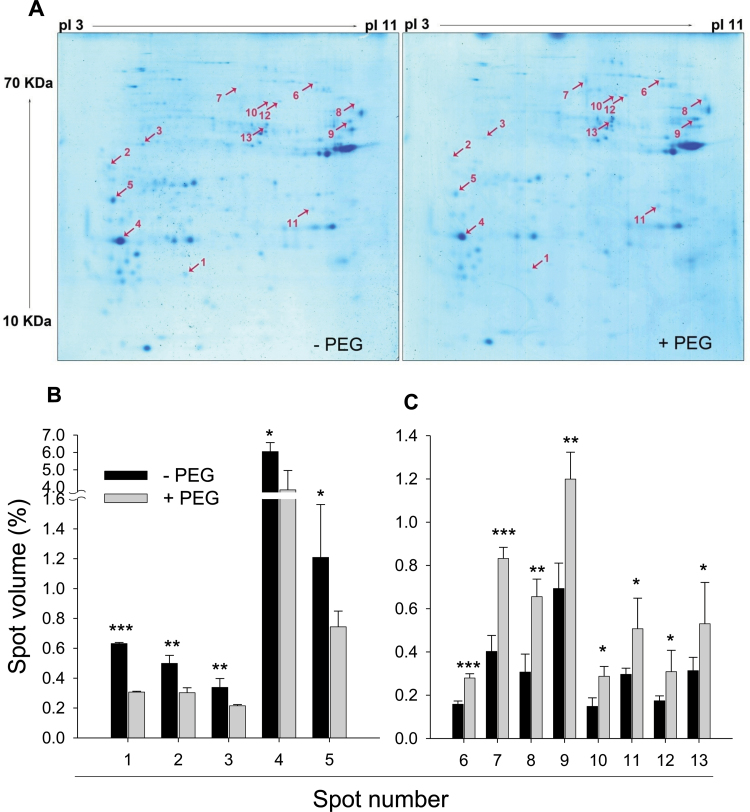
Fig. 3.
Representative CBB-stained 2D-IEF/SDS-PAGE gel images of apoplastic proteins (A) and the relative volume of the 13 significantly decreased (B) and increased (C) apoplastic protein spots in control (–PEG) and PEG-treated root tips of common bean genotype VAX 1. Plants were pre-cultured in a simplified nutrient solution containing 5mM CaCl2, 1mM KCl, and 8 µM H3BO3 for 48h for acclimation and pH adaptation, and then treated without or with PEG (150g l–1) in the simplified nutrient solution (pH 4.5) for 24h. Apoplastic proteins were extracted from root tips, separated by 2D-IEF/SDS-PAGE, and stained by CBB. Treatment-affected spots were marked by arrows and numbered consecutively. Three independent biological replications of each treatment were analysed using Image MasterTM 2D PLATINUM Software 6.0. In (B), bars represent means ±SD, n=3. *, **, and *** denote significant PEG treatment differences at P<0.05, P<0.01, and P<0.001, respectively. (This figure is available in colour at JXB online.)

