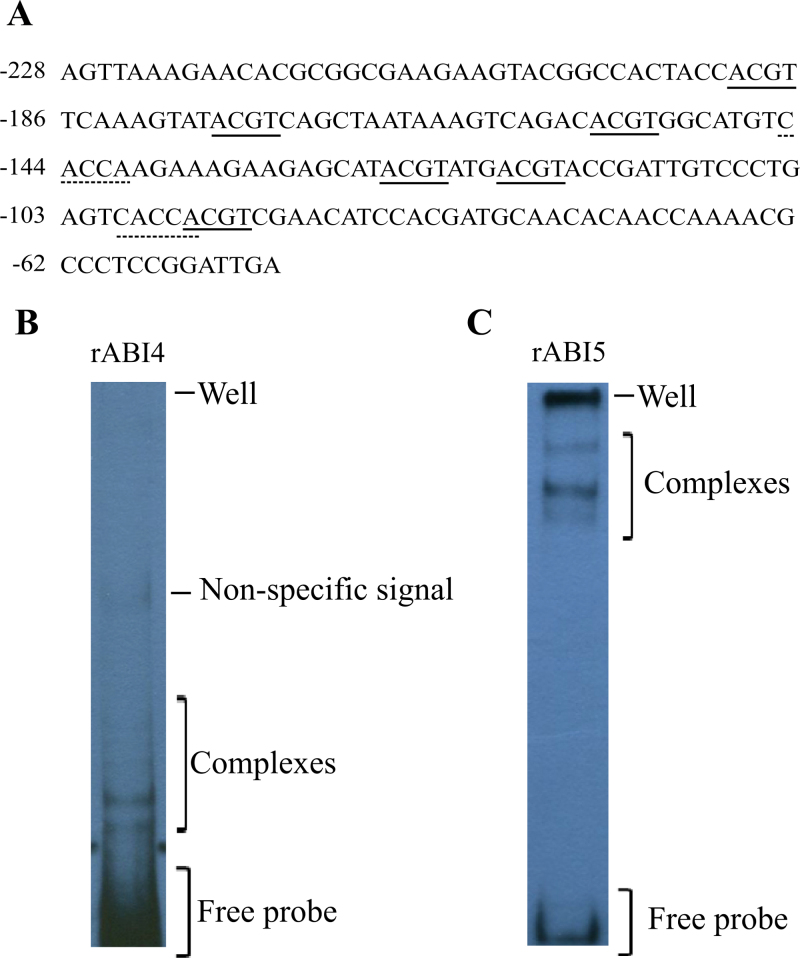
Fig. 4.
rABI4 and rABI5 binding affinity for an AtEm6 promoter biotinylated probe. (A) AtEm6 biotinylated probe sequence (186bp). Positions are given relative to the first base of the initiating methionine (ATG). ACGT cores for putative ABREs (solid lines) and CE-like (dashed lines) motifs are indicated. (B) Band shift pattern for rABI4. A 40ng aliquot of AtEm6 biotinylated probe was incubated with 0.225 μg of rABI4. (C) Band shift pattern for rABI5. A 40ng aliquot of AtEm6 biotinylated probe was incubated with 0.375 μg of rABI5. In all cases, complexes detected, well position, and free probe are indicated. (This figure is available in colour at JXB online.)

