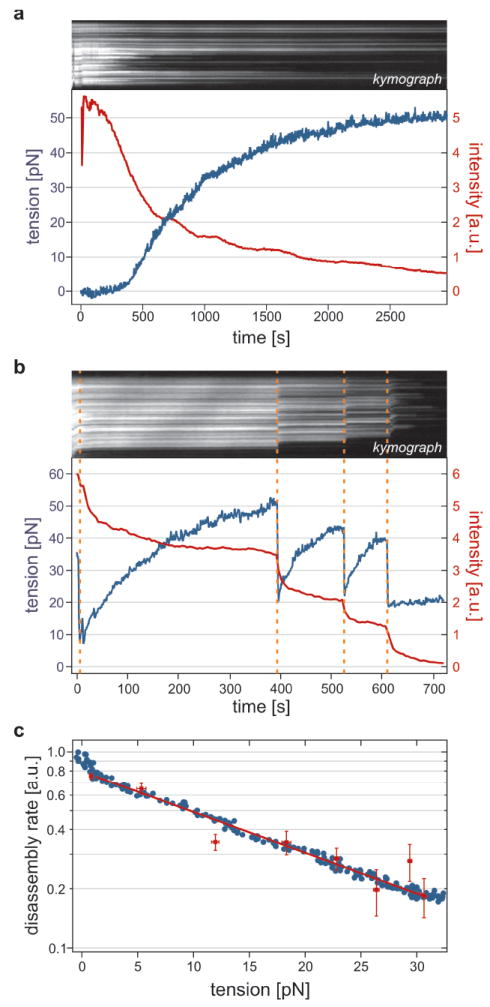
Figure 2. RAD51 disassembly rate is reversibly reduced by DNA tension.

a, Kymograph and intensity trace (red) of a RAD51–dsDNA complex, held at fixed length, triggered to disassemble at t = 0. Tension (blue) increases due to disassembly-induced DNA contraction, leveling off to stall around 50 pN. Intensity decrease slows down accordingly. b, Tension-stalled disassembly is reinitiated by tension release (orange dashes). c, Disassembly rates decrease exponentially with tension. Directly differentiated intensity trace (red symbols) and smoothed trace (blue) are fitted by Arrhenius’ equation, yielding the same x†-value (0.20 ± 0.01 nm for this complex). See Supplementary Information for calculation.
