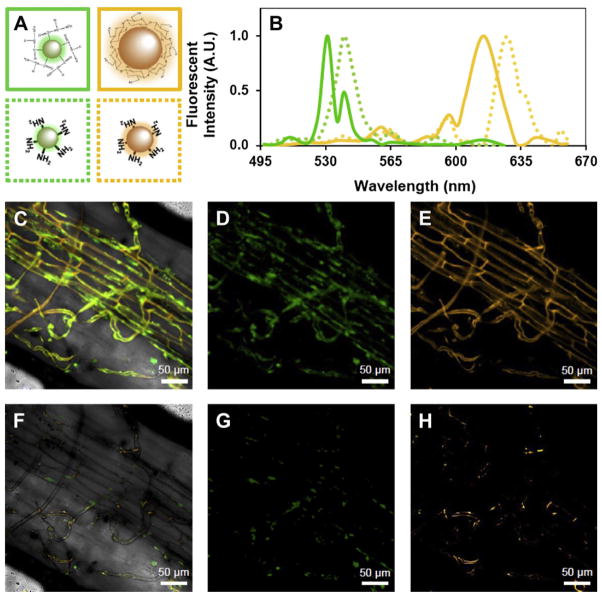
Fig. 1.
Emission spectra of QD-glycine and QD-chitosan within intraradical AM hyphae. (A) Conceptual diagram of QD-glycine (solid green box), QD-chitosan (solid orange box), and amino terminated QDs representing the N mineralized form of each (dashed boxes of corresponding color). (B) Reference spectra of QD-glycine (solid green line); “N mineralized” QD-glycine (dotted green line); QD-chitosan (solid orange line); and “N mineralized” QD-chitosan (dotted orange line). For both QD-glycine and QD-chitosan, substrate mineralization resulted in a slight red shift in the emission spectra. (C) Superimposed laser scans of a plant root (from an N-fertilized plot) colonized by AM hyphae: where (D) green represents intact QD-glycine and (E) orange represents intact QD-chitosan. (F) Superimposed scans of “N mineralized” QD-glycine (G) and mineralized (H). Sample was taken from an N fertilized plot. Emission fingerprints were scanned from 494 to 660 nm (4.74 nm increments) using a Zeiss 710 (Quasar spectral detection unit) confocal microscope, on a 40× oil objective. Scale bars are 50 μm. Conceptual diagram (A) is not drawn to scale. (For interpretation of the references to color in this figure legend, the reader is referred to the web version of this article.)

