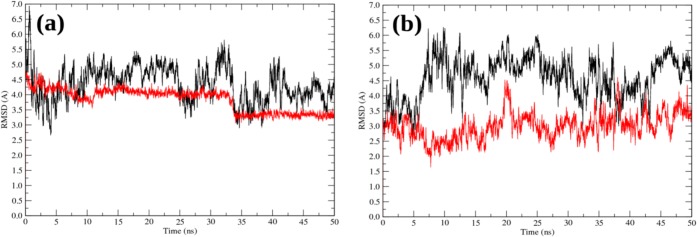
Figure 5.

RMSD plots during 50 ns production trajectory in water (black) and the SiO2-surface adsorption trajectory (red) obtained for the native peptide under the same conditions: (a) 0.05 M ionic strength at 293 K; (b) 0.05 M ionic strength at 333 K. In both cases, the SPME method for electrostatic interactions was employed. The RMSD was calculated with respect to the starting structure for a given trajectory. The preparation period (minimization, heating, and equilibration) is omitted.
