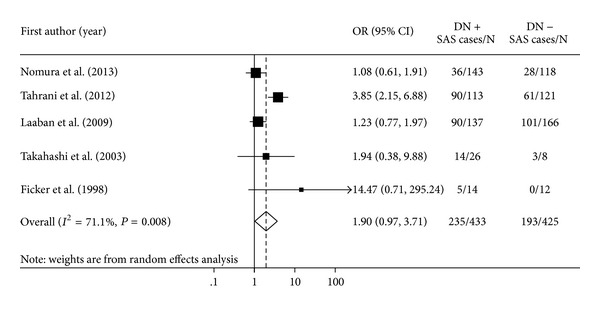
Figure 2.

Forest plot showing the odds ratios (ORs) with 95% confidence interval (95% CI) of sleep apnea syndrome (SAS) for participants with diabetic neuropathy (DN) compared to participants without DN. Pooled OR is indicated by a diamond. The 95% CI of each OR is indicated by a vertical line. Size of squares reflects the statistical weight of each study.
