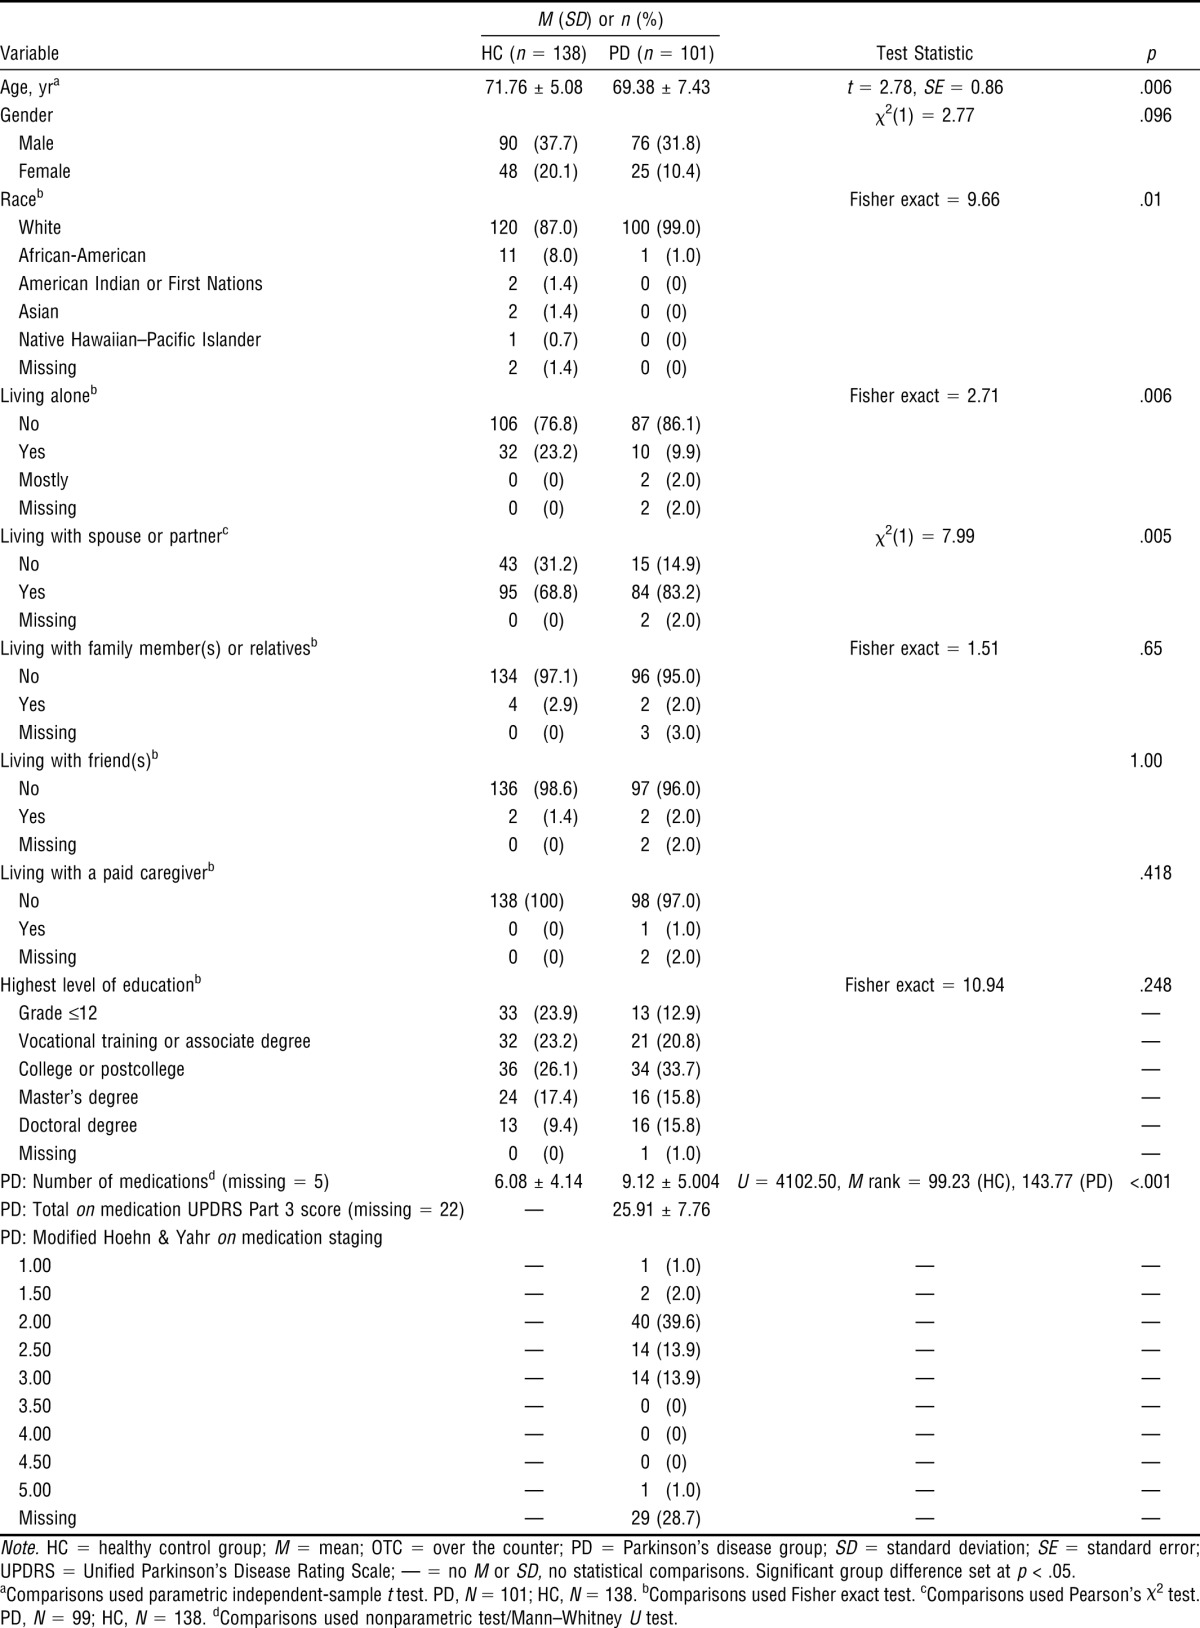
Table 1.
Descriptive Statistics and Between-Group Differences for Demographics and Medication Use of Drivers With Parkinson's Disease and Healthy Control Drivers

|
M (SD) or n (%) |
||||
| Variable | HC (n = 138) | PD (n = 101) | Test Statistic | p |
| Age, yra | 71.76 ± 5.08 | 69.38 ± 7.43 | t = 2.78, SE = 0.86 | .006 |
| Gender | χ2(1) = 2.77 | .096 | ||
| Male | 90 (37.7) | 76 (31.8) | ||
| Female | 48 (20.1) | 25 (10.4) | ||
| Raceb | Fisher exact = 9.66 | .01 | ||
| White | 120 (87.0) | 100 (99.0) | ||
| African-American | 11 (8.0) | 1 (1.0) | ||
| American Indian or First Nations | 2 (1.4) | 0 (0) | ||
| Asian | 2 (1.4) | 0 (0) | ||
| Native Hawaiian–Pacific Islander | 1 (0.7) | 0 (0) | ||
| Missing | 2 (1.4) | 0 (0) | ||
| Living aloneb | Fisher exact = 2.71 | .006 | ||
| No | 106 (76.8) | 87 (86.1) | ||
| Yes | 32 (23.2) | 10 (9.9) | ||
| Mostly | 0 (0) | 2 (2.0) | ||
| Missing | 0 (0) | 2 (2.0) | ||
| Living with spouse or partnerc | χ2(1) = 7.99 | .005 | ||
| No | 43 (31.2) | 15 (14.9) | ||
| Yes | 95 (68.8) | 84 (83.2) | ||
| Missing | 0 (0) | 2 (2.0) | ||
| Living with family member(s) or relativesb | Fisher exact = 1.51 | .65 | ||
| No | 134 (97.1) | 96 (95.0) | ||
| Yes | 4 (2.9) | 2 (2.0) | ||
| Missing | 0 (0) | 3 (3.0) | ||
| Living with friend(s)b | 1.00 | |||
| No | 136 (98.6) | 97 (96.0) | ||
| Yes | 2 (1.4) | 2 (2.0) | ||
| Missing | 0 (0) | 2 (2.0) | ||
| Living with a paid caregiverb | .418 | |||
| No | 138 (100) | 98 (97.0) | ||
| Yes | 0 (0) | 1 (1.0) | ||
| Missing | 0 (0) | 2 (2.0) | ||
| Highest level of educationb | Fisher exact = 10.94 | .248 | ||
| Grade ≤12 | 33 (23.9) | 13 (12.9) | — | |
| Vocational training or associate degree | 32 (23.2) | 21 (20.8) | — | |
| College or postcollege | 36 (26.1) | 34 (33.7) | — | |
| Master’s degree | 24 (17.4) | 16 (15.8) | — | |
| Doctoral degree | 13 (9.4) | 16 (15.8) | — | |
| Missing | 0 (0) | 1 (1.0) | — | |
| PD: Number of medicationsd (missing = 5) | 6.08 ± 4.14 | 9.12 ± 5.004 | U = 4102.50, M rank = 99.23 (HC), 143.77 (PD) | <.001 |
| PD: Total on medication UPDRS Part 3 score (missing = 22) | — | 25.91 ± 7.76 | ||
| PD: Modified Hoehn & Yahr on medication staging | ||||
| 1.00 | — | 1 (1.0) | — | — |
| 1.50 | — | 2 (2.0) | — | — |
| 2.00 | — | 40 (39.6) | — | — |
| 2.50 | — | 14 (13.9) | — | — |
| 3.00 | — | 14 (13.9) | — | — |
| 3.50 | — | 0 (0) | — | — |
| 4.00 | — | 0 (0) | — | — |
| 4.50 | — | 0 (0) | — | — |
| 5.00 | — | 1 (1.0) | — | — |
| Missing | — | 29 (28.7) | — | — |
Note. HC = healthy control group; M = mean; OTC = over the counter; PD = Parkinson's disease group; SD = standard deviation; SE = standard error; UPDRS = Unified Parkinson’s Disease Rating Scale; — = no M or SD, no statistical comparisons. Significant group difference set at p < .05.
aComparisons used parametric independent-sample t test. PD, N = 101; HC, N = 138. bComparisons used Fisher exact test. cComparisons used Pearson’s χ2 test. PD, N = 99; HC, N = 138. dComparisons used nonparametric test/Mann–Whitney U test.
