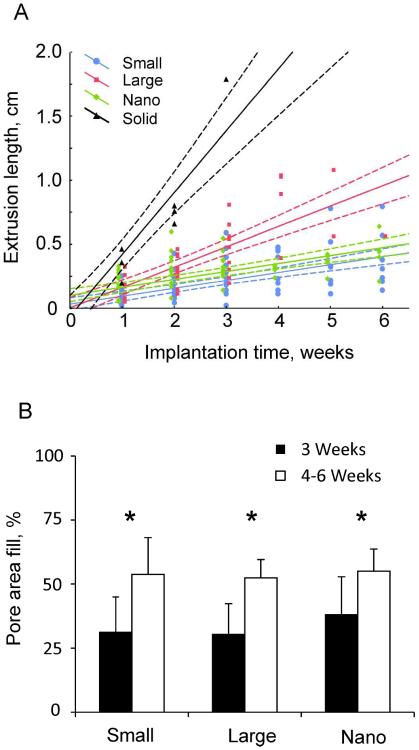
Figure 5.
A: Extrusion length for each implant type as a function of implantation time; solid lines are linear regression lines, dashed lines are 95%-confidence limits. Linear regression equations between implantation time (x, weeks) and extrusion length (y, cm) are as follows. Solid implants: y=−0.0642+0.4833*x (r=0.946, p<0.05); Large implants: y=0.002+0.1591*x (r=0.824, p<0.05); Small implants: y=0.0315+0.0619*x (r=0.657, p<0.05); Nano implants: y=0.1008+0.0621*x (r=0.704, p<0.05).
B: Percentage of total pore area filled with stained tissue (mean+SD). The data from pylons that remained implanted beyond 4 weeks (see Table 2) were combined into the 4–6 week implantation group for purposes of statistical analysis. * indicates significant (p < 0.05) difference between 3 weeks and 4–6 weeks of implantation. No differences were found between implant types.

