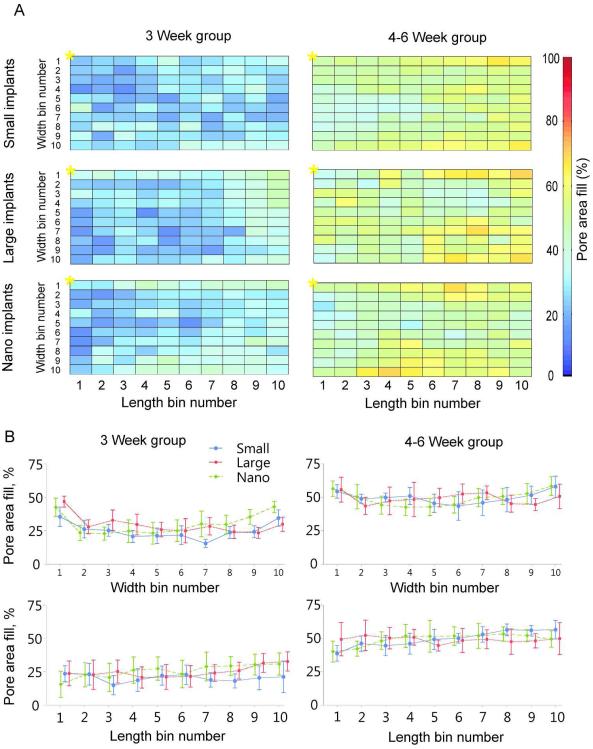
Figure 6.
Distribution of mean skin ingrowth within different porous implants. A: Each panel represents normalized pore area of implant under the skin. The area is divided into 100 bins. The top row of bins in each panel indicates the pore area at the upper edge of implant right under the dermis. The left most column represents the bins that would line along the implant exit site; * indicates bin1,1 (see Fig. 2 D for further details). Percentage pore area filed with skin tissue is shown for each bin by color. B (top panels): Skin ingrowth (±SD) averaged across length bins as a function of implant width for each type of implant and implantation period – 3 weeks (left panels) and 4–6 weeks (right panels). Bottom panels: Skin ingrowth (±SD) averaged across width bins as a function of implant length for each type of implant and implantation period.

