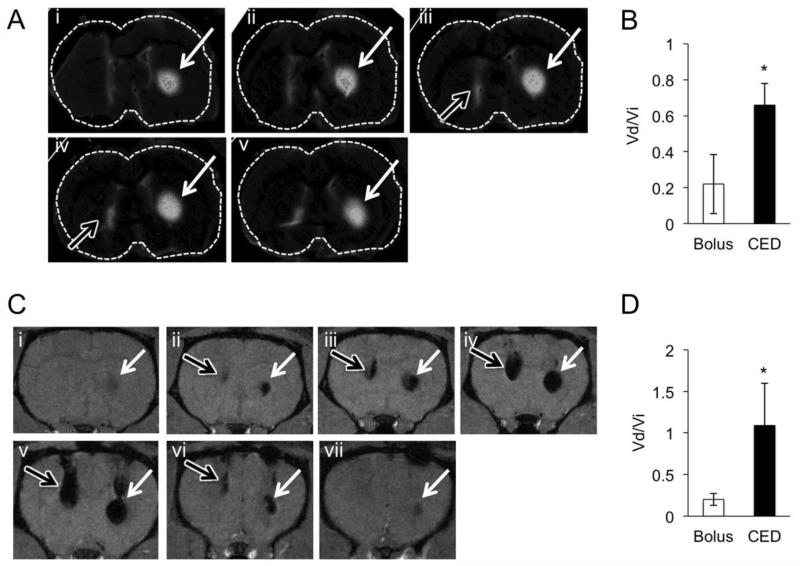
Figure 2. CED increases intracranial distribution of PMNPs.
(A) Sequential images of a representative rat brain following infusion of 25 μl PMNPs by CED (white arrows) or bolus injection (black arrows). Slices represent a total of 900 μm in the AP-dimension. (B) Graph of Vd/Vi following infusion of 25 μl of fluorescent PMNPs. Data shows mean value +/− SD. (n = 4 animals per group). * P < 0.05. (C) Sequential T2 weighted images following CED (white arrows, right) or bolus infusion (black arrows, left) of 25 μl PMNPs. Slices represent a total of 3.0 mm in the AP-dimension. (D) Vd/Vi following CED or bolus injection as assessed by MRI following infusion of 25 μl PMNPs. (n = 4 animals per group). * P < 0.05.

