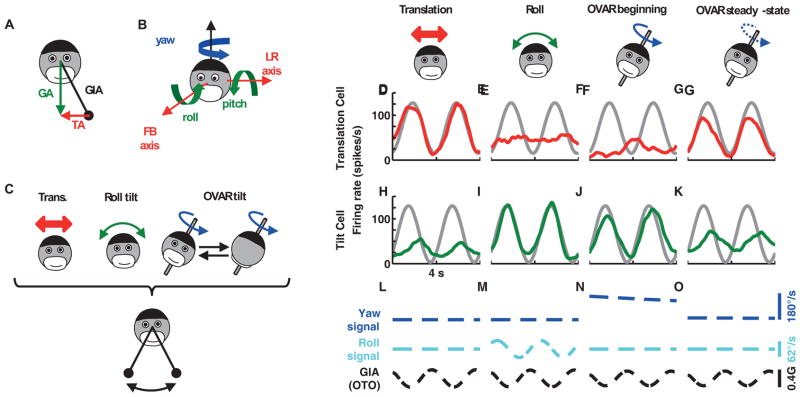
Figure 1. Tilt and translation protocols and responses from example cells.
(A) Equivalence principle: the otolith organs are sensitive to the gravito-inertial acceleration (GIA), which is equal to the difference between the gravity vector (GA) and the translational acceleration (TA). (B) Naming conventions of the head’s translation and rotation axes. (C) Representation of the motion protocols used in this study. The GIA stimulus along the LR axis, represented by a swinging pendulum (bottom), is identical during the 3 protocols (translation, tilt, OVAR). (D–O) responses from a translation-selective cell (red) and a tilt-selective cell (green) during (D), (H) left-right (LR) translation, (E), (I) roll tilt, (F), (G), (J), (K) constant velocity off-vertical axis rotation (OVAR). (L), (M), (N) and (O) illustrate the corresponding yaw velocity (detected by horizontal canals, blue), roll velocity (detected by vertical canals, cyan) and GIA along the LR axis (detected by otolith organs, OTO; black). Gray curves: fit to the LR translation response (shown in D, translation cell) or the roll tilt response (shown in I, tilt cell). We compared the cell’s OVAR modulation to the gray response, and computed a gain ratio (see Experimental Procedures): F: Gtrans=0.2, ϕtrans=156°; G: Gtrans=0.9, ϕtrans=12°; J: Gtilt=0.9, ϕtilt=−27°; K: Gtilt=0.4, ϕtilt=−86°. Note that the two cells were chosen to have a negligible response to pitch and FB translation, such that these components could be ignored (for illustrative purposes only; all data were analyzed using a vectorial approach; see Experimental Procedures). OVAR beginning shows 3–7s after motion onset. OVAR steady-state illustrates 51–55s (translation cell) or 63–67s (tilt cell) after motion onset. Additional response profiles can be found in Figure S1.

