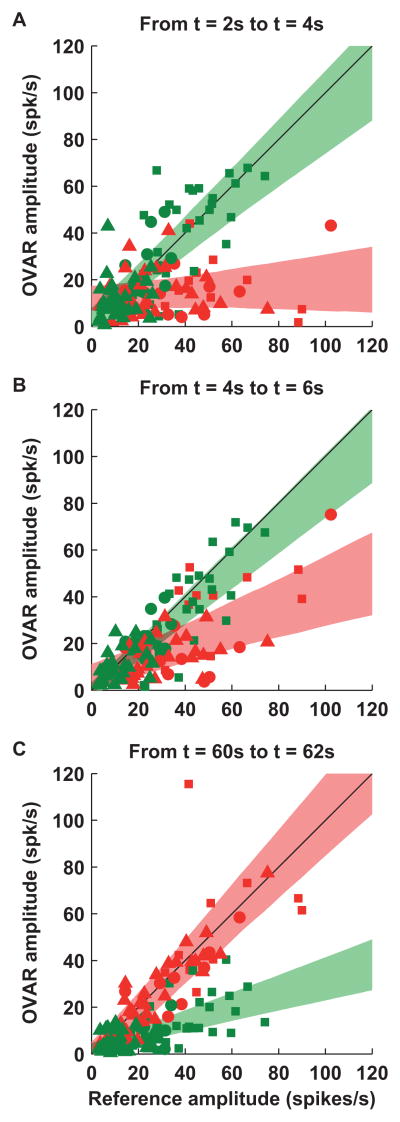
Figure 4. Comparison of the response during OVAR with the ‘rereference’ response during tilt or translation on a cell-by-cell basis.
Modulation amplitude during OVAR at (A) t=2–4s, (B) t=4–6s and (C) t=60–62s after motion onset is plotted versus tilt (for tilt-selective Purkinje cells, n=37, green) or translation (for translation-selective cells, n=27, red) reference amplitude (i.e. the response amplitude expected in response to a tilt or translation stimulus equivalent to OVAR; see Experimental Procedures; e.g., gray lines in Figure 1D–O). Two data points are shown per cell (corresponding to the two rotation directions; see Experimental Procedures). Linear regressions were performed, with the 95% confidence intervals represented by green and red bands. Different symbols are used for different animals (squares: animal V; circles: animal T; triangles: animal K). Phase values are illustrated in Figure S4. Reconstructed positions of recorded cells in stereotaxic coordinates are illustrated in Figure S3.

