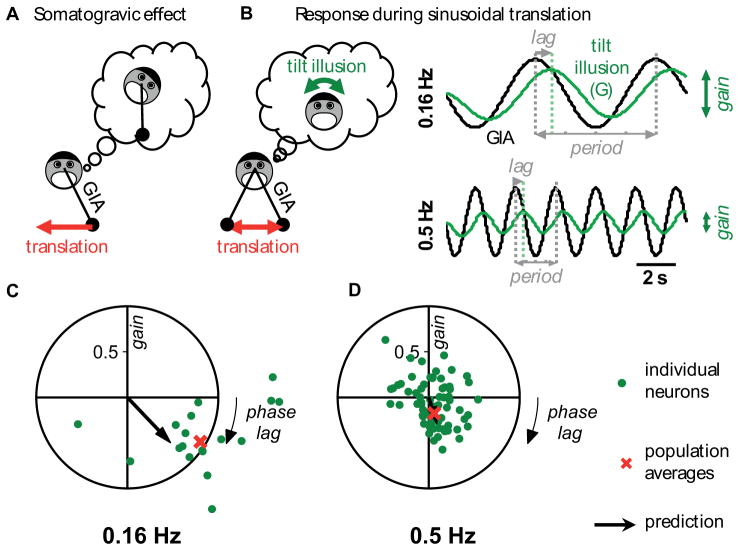
Figure 7. Responses of tilt-selective Purkinje cells during translation at two frequencies and comparison with somatogravic feedback predictions.
(A) Somatogravic effect: a constant acceleration is interpreted as tilt. (B) illustration and simulation of the tilt illusion attributable to the somatogravic feedback during sinusoidal translation at 0.16 Hz (top) and 0.5 Hz (bottom). (C), (D) measured normalized response, hsoma = htrans/htilt, shown as polar plots where the radius illustrates its gain and the polar angle its phase (see Experimental Procedures). Green dots: response of individual cells (0.16 Hz: n=18; 0.5 Hz: n = 71 cells). Red cross: average response of the tilt cell population, computed by linear regression (see Experimental Procedures). Black arrow: response predicted by the model. These data are also shown as gain vs. frequency plots in Figure S6.

