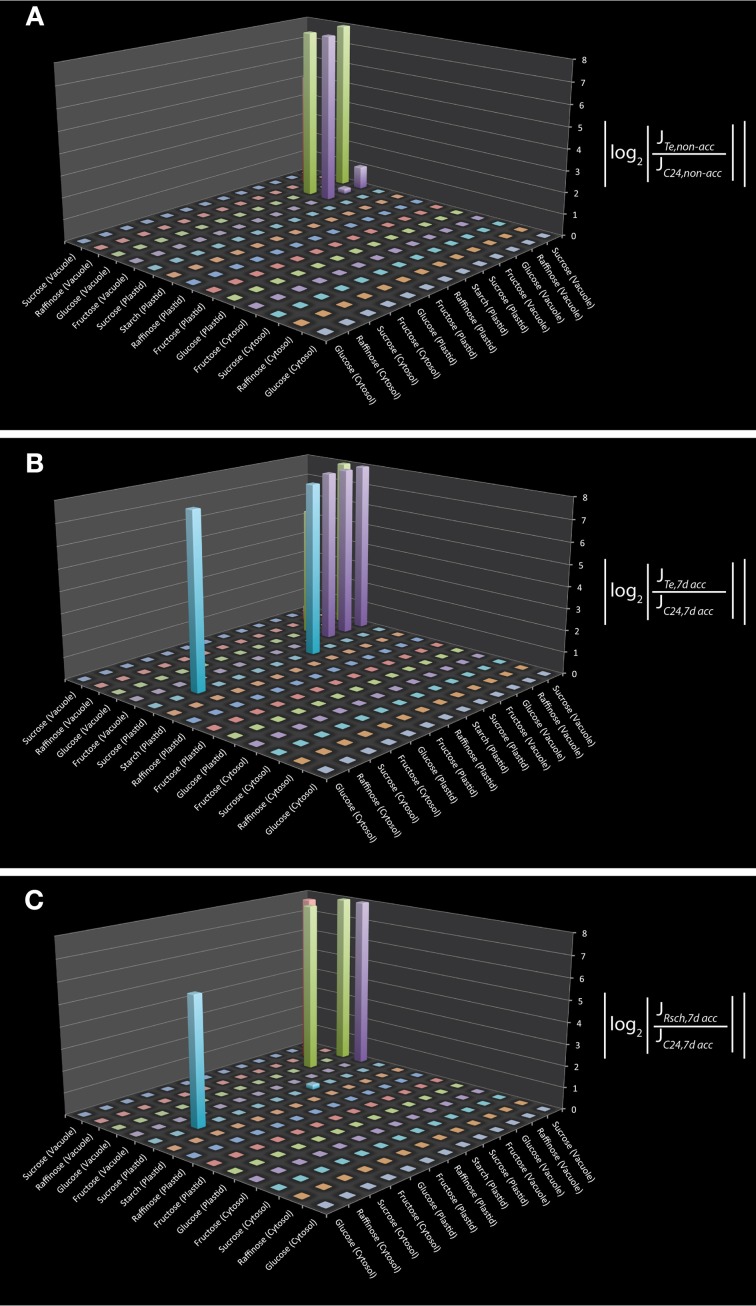
Figure 1.
Differential Jacobian matrices derived from inverse calculations on subcellular carbohydrate concentrations. Differential Jacobians were built for Te and C24 before (A), and after (B) 7 days of cold exposure. For Rsch and C24, the differential Jacobian was built for 7 day cold exposed samples (C). Experimental data were taken from a previous study (Nägele and Heyer, 2013). Metabolic interaction sites are indicated on the horizontal x- and y-axis by the metabolites which participate in the reaction that is characterized by the entry of the Jacobian matrix. For example, in (B) the interaction of plastidial and cytosolic sucrose is significantly different between Te and C24 (non-diagonal blue bar). This can also be observed in (C) but not in (A).

