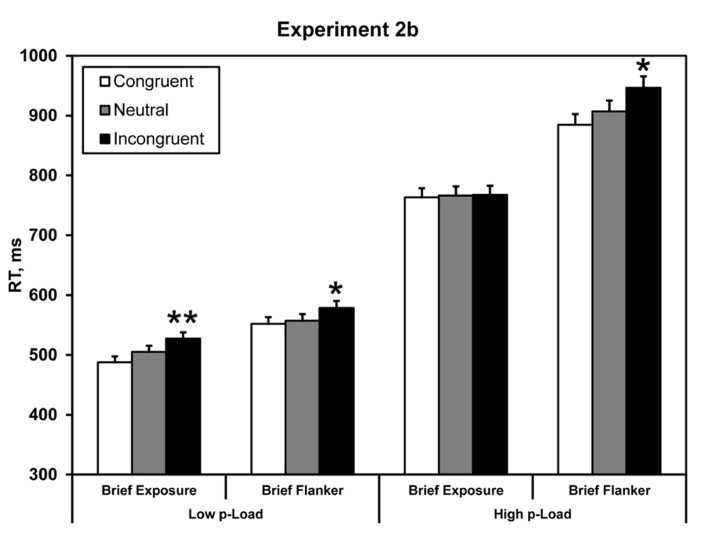
FIGURE 5.
Mean correct RT in Experiment 2b. Briefly exposed stimuli were presented for 100 ms – all other stimuli were response-terminated. Asterisks denote significance from neutral condition: *p < 0.05, **p < 0.01. Error bars represent 95% within-observers confidence intervals (Loftus and Masson, 1994; Morey, 2008).

