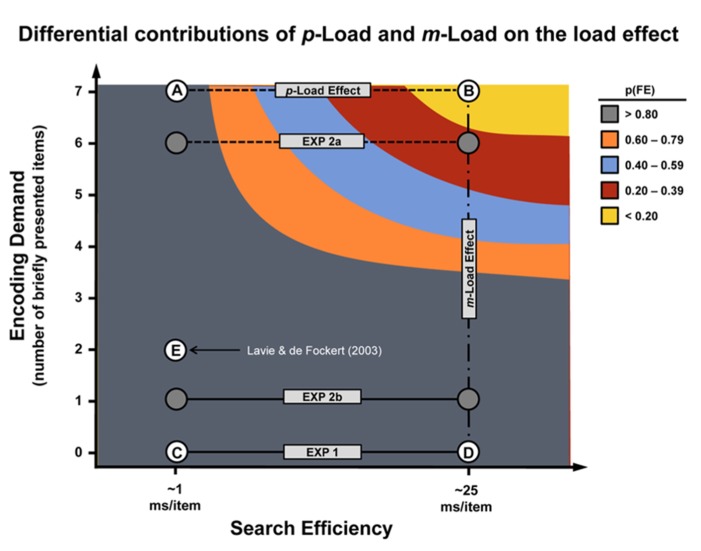
FIGURE 6.
Load effect “resources.” This empirically derived model illustrates two forms of “resource” demand – feature- and encoding-based – that impinge upon selective attention to produce the load effect (denoted by dashed lines). The vertical axis denotes the m-Load and is quantified as the number of briefly exposed display stimuli. The horizontal axis denotes the p-Load and is quantified in terms of the search efficiency of the displays. These values are estimated based on our previous work exploring the role of visual search and load (Duncan and Humphreys, 1989; Roper et al., 2013). Points A and B represent the canonical low p-Load and high p-Load tasks, respectively. Tasks represented by point A and B served as control conditions for Experiments 1 and 2. Low p-Load was characterized by a conspicuous target (search efficiency ~1 ms/item), whereas high p-Load was characterized by an inconspicuous target (search efficiency ~25 ms/item) – both conditions are characterized by high m-Load (7 stimuli at 100 ms exposure). Experiments 2a and 2b, denoted by filled circles, were hybridized and fall between line segments AB and CD in terms of m-Load (see Experiment 2 methods). Point C represents a low m-Load, low p-Load task and point D represents a low m-Load, high p-Load task (both unique to Experiment 1). Point E reflects a high m-Load, low p-Load task (Experiment 2, Lavie and de Fockert, 2003). N.B., although feature competition and encoding demands can be manipulated orthogonally, it is not entirely clear whether these factors are psychologically independent. The shape of the curve is intended for demonstration only.

