Fig. 1.

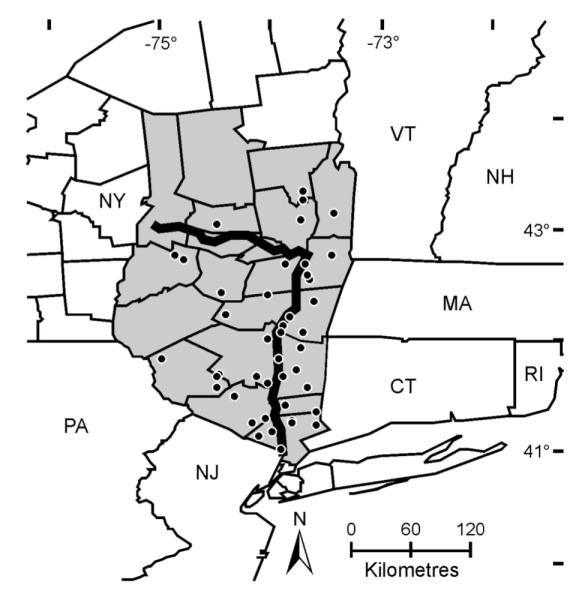
Map of the study area. The locations of tick density estimates are represented as black dots, the Hudson and Mohawk Rivers in a bold line, and the counties of New York State considered in this study are shaded.

Map of the study area. The locations of tick density estimates are represented as black dots, the Hudson and Mohawk Rivers in a bold line, and the counties of New York State considered in this study are shaded.