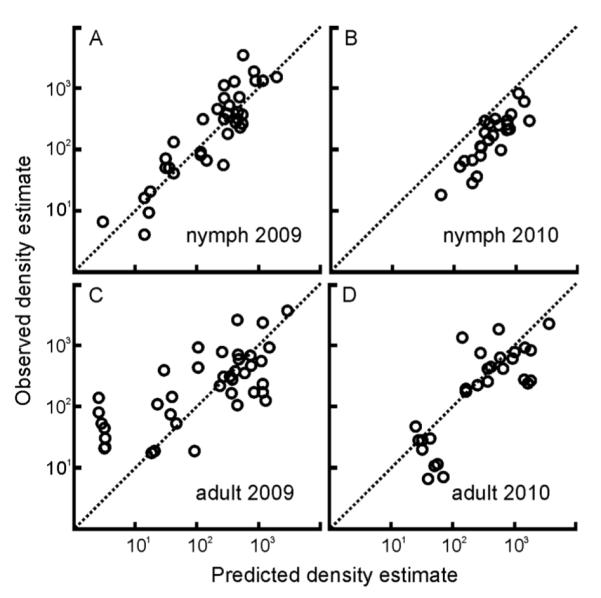
Fig. 3.

The nymph and adult density estimate regression models built using data from 2004–2008 accurately predict the tick density estimates in 2009 and 2010. Estimates predicted by the nymphal model explain (A) 80% of the variation in the observed nymph density estimates from 2009 (R2=0.8, n=35, P < 0.0001) and (B) 74% of the variation in the observed tick density estimates from 2010 (R2=0.74, n=26, P < 0.0001). Estimates predicted by the adult model explains (C) 48% of the variation in the observed adult density estimates from 2009 (R2 = 0.48, n = 40, P < 0.0001) and (D) 67% of the variation in the observed tick density estimates from 2010 (R2=0.67, n=29, P < 0.0001). Original units prior to log transformation are individuals/hectares. The dotted diagonal line through the origin represents the ideal correspondence (1:1) between observed and predicted density estimates.
