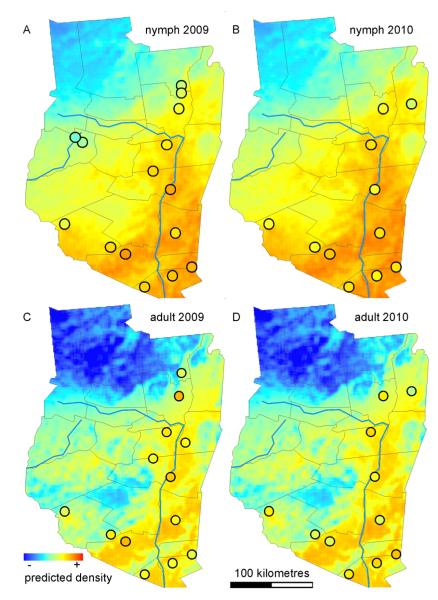
Fig. 4.
Spatial representation of predictions for nymph (2009 [A] and 2010 [B]) and adult (2009 [C] and 2010 [D]) density estimates. The performance of selected models are shown using the predicted collection values for the region plotted as a surface (original units prior to log transformation are individuals/30-arcsecond pixels) for year 2009 and 2010 and the observed collection values (circles). The observed values represent the average of multiple samples collected in the same year and location. Matching of color inside the circles with the continuous surfaces describes the accuracy of the model predictions.

