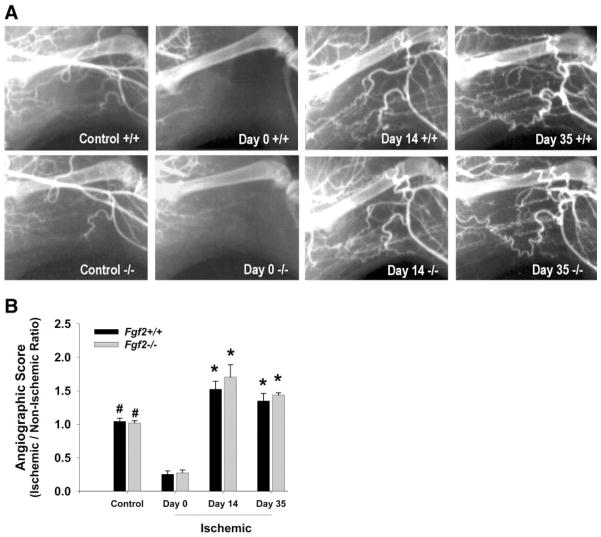
Fig. 6.
A: representative angiograms in left hindlimbs of Fgf 2+/+ and Fgf 2−/− mice without ligation (control), immediately after ligation (day 0), 14 days after surgery, and 35 days after surgery. B: quantification of angiographically visible arteries in hindlimb. Angiographic score is expressed as left hindlimb vessel area divided by right hindlimb vessel area. *P < 0.05 vs. control and vs. day 0. #P < 0.05 vs. day 0. Fgf 2+/+ vs. Fgf 2−/−, not significantly different.

