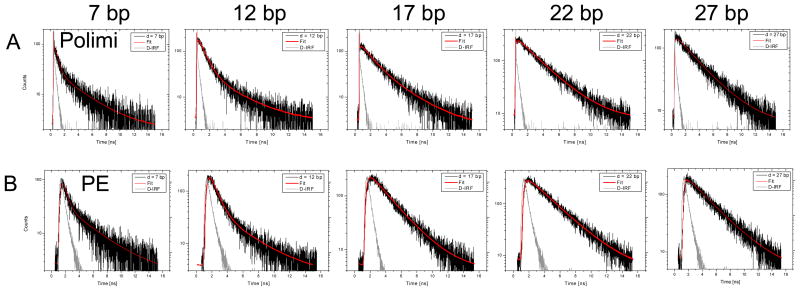
Figure 4.
Nanotime histograms of the FRET population for the 5 samples (d = 7, 12, 17, 22 and 27 from left to right) as collected with the Polimi detectors (top row) and Perkin-Elmer detectors (bottom row). A single laser period of 14.8 ns is shown (first time axis tick: 0 ns, last tick: 16 ns). The black curves (in units of counts per TAC bin) are the calibrated decays, shown with the corresponding multi-exponential fits in red. The IRF is shown in light gray (arbitrary units). The fitted lifetimes are reported in Table 2.

