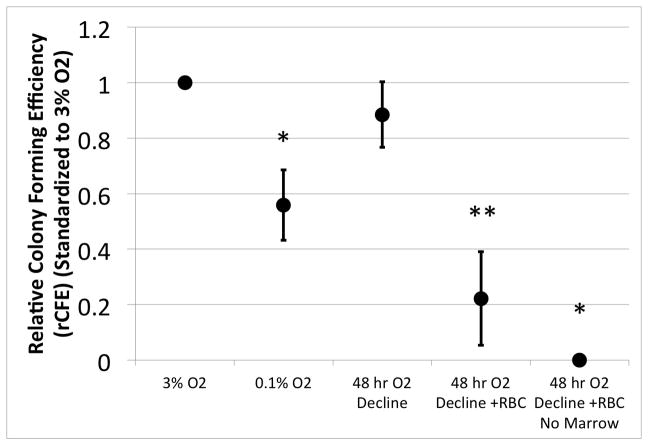
Figure 4. The Effect of RBCs and Slowed Oxygen Decline on the CFE of Canine CTPs.
The data represent the mean with 95% confidence interval for rCFE for each condition (N=4). A single asterisk (‘*’) denotes a significant difference from all other conditions (p<0.05). A double asterisk (‘**’) denotes a significant difference from ‘3% O2’, ‘48 hr O2 Decline’, and ‘48 hr O2 Decline + RBC, No Marrow’ (p<0.05).

