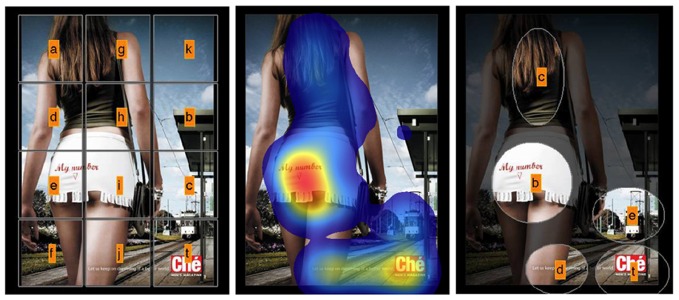
Figure 3.

Two methods for AOI production used in this study. The left panel contain the gridded AOIs. The right panel contains the hand drawn AOIs. These AOIs are based on the heat map (middle panel) and aim at capturing fixation clusters. The target AOI (the brand logo) is coded with “t”. This manuscript is not about AOI-production. We used these two extreme methods to show the robustness of our measures, not to show any preference for one of the two methods.
