
Figure 7.
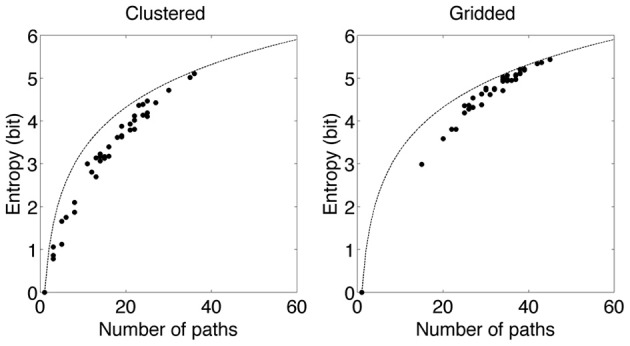
Entropy as function of the number of scan paths. A single dot represents data from an individual advertisement. The line denotes the maximum entropy given the number of paths. The previous is calculated from a flat distribution of scan paths. In the gridded condition for high number of paths the measured entropy resembles the maximum entropy for that specific number of paths. In the clustered condition for both high and low number of paths the measured entropy resembles the maximum entropy for that specific number of paths.