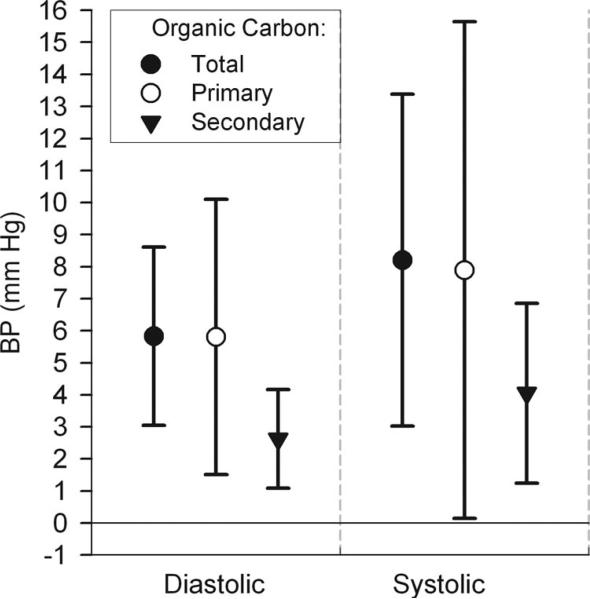
FIGURE 3.
Associations of blood pressure with 5-day average outdoor home organic carbon: differences by primary and secondary organic carbon fractions. Estimates and 95% CIs are for interquartile increases in the air pollutant, adjusted for the same variables as in Figure 1, and restricted to hours the subjects were at home.

