Figure 2.

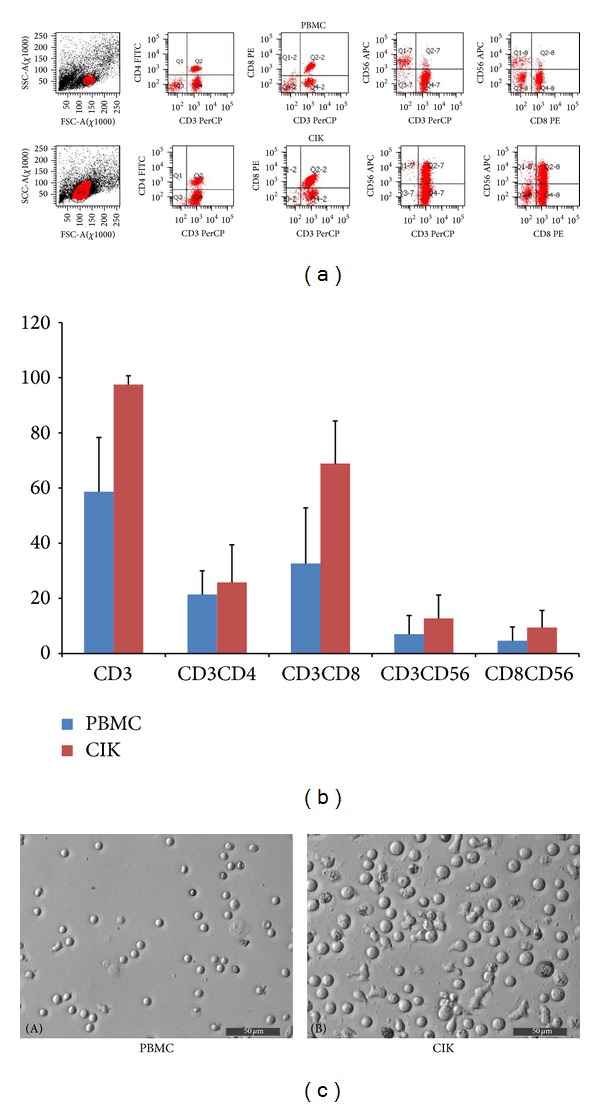
Phenotype analysis of cells from patients and detection of CIK cells and leukemic markers by FACS analysis. All cell samples for phenotype analysis were stained with FITC-conjugated antibodies against CD4, PE-conjugated antibodies against CD8, and APC-conjugated antibodies against CD56. (a) Typical phenotype analysis of PBMCs and CIK cells from CIK cell treatment group patient 7. (b) Comparison of the phenotype analyses of PBMCs and CIK cells. Phenotype comparisons were performed in samples from 10 patients who received CIK cell treatment, and the results were expressed as means ± SD. (c) Lymphocyte culture (PBMC and CIK). (A) PBMCs before isolation, induction and culture; some T lymphocytes can be seen in the peripheral blood. (B) After isolation, induction, and culture, lymphocytes become larger.
