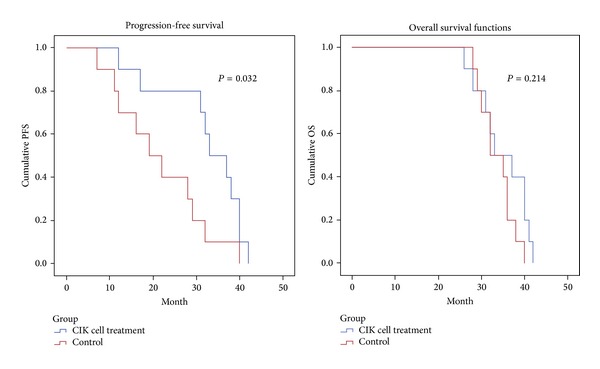
Figure 3.

Kaplan-Meier estimates of progression-free survival (PFS) and overall survival (OS). Left figure: PFS. Blue line: CIK cell treatment group. Red line: control group. Log-rank: P = 0.032. Right figure: OS. Blue line: CIK cell treatment group. Red line: control group. Log-rank: P = 0.214; all patients were alive during the course of followup, and there were no statistically significant differences between two groups in OS.
