
Figure 1.
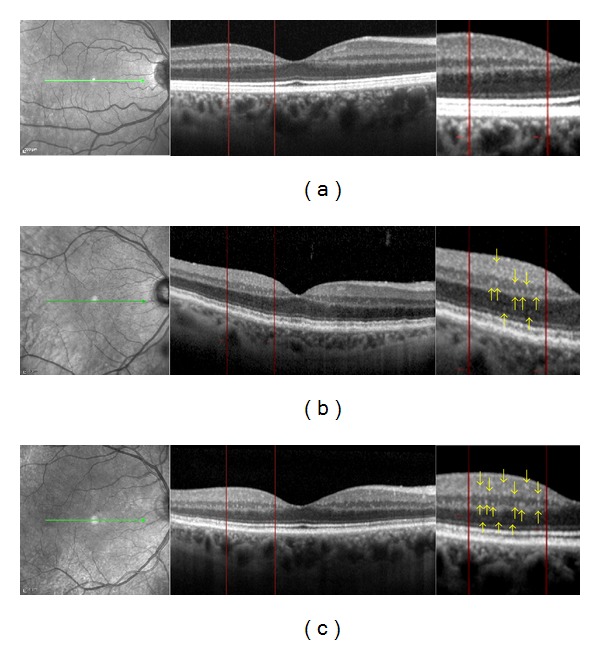
Spectral domain OCT linear scans in the macula of (a) normal subject, (b) diabetic patient without retinopathy, and (c) diabetic patient with mild nonproliferative diabetic retinopathy. Two vertical lines were traced at 500 μm and 1500 μm from the center of the fovea in the temporal region where the count of the hyperreflective spots was performed. The count was performed in the following retinal layers: inner limiting membrane (ILM) to ganglion cell layer (GCL), inner nuclear layer (INL) to outer plexiform layer (OPL), and outer nuclear layer (ONL). The yellow arrows indicate the HRS seen on the magnification image. The number of HRS is higher in diabetic eyes with DR versus diabetic eyes without retinopathy.