
Figure 2.
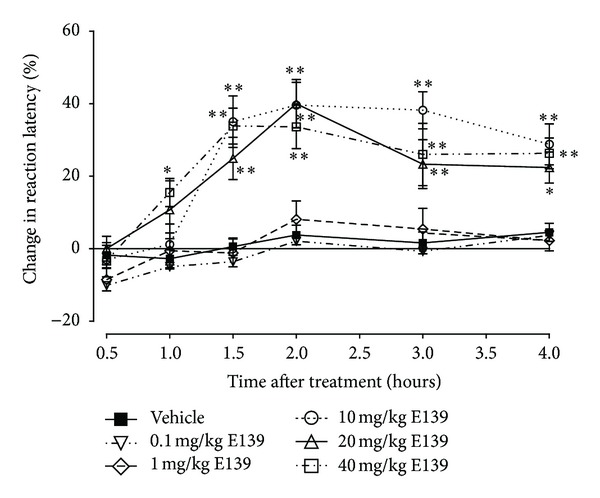
Time course of the percentage change in reaction latency time for various doses of E139 (0.1–40 mg/kg) in a hot-plate test in naïve BALB/c mice. Each point represents the mean ± S.E.M of values obtained from 10 animals. *P < 0.05 and **P < 0.01 compared to drug vehicle at the same time point after treatment (two-way repeated measures ANOVA followed by Bonferroni test).