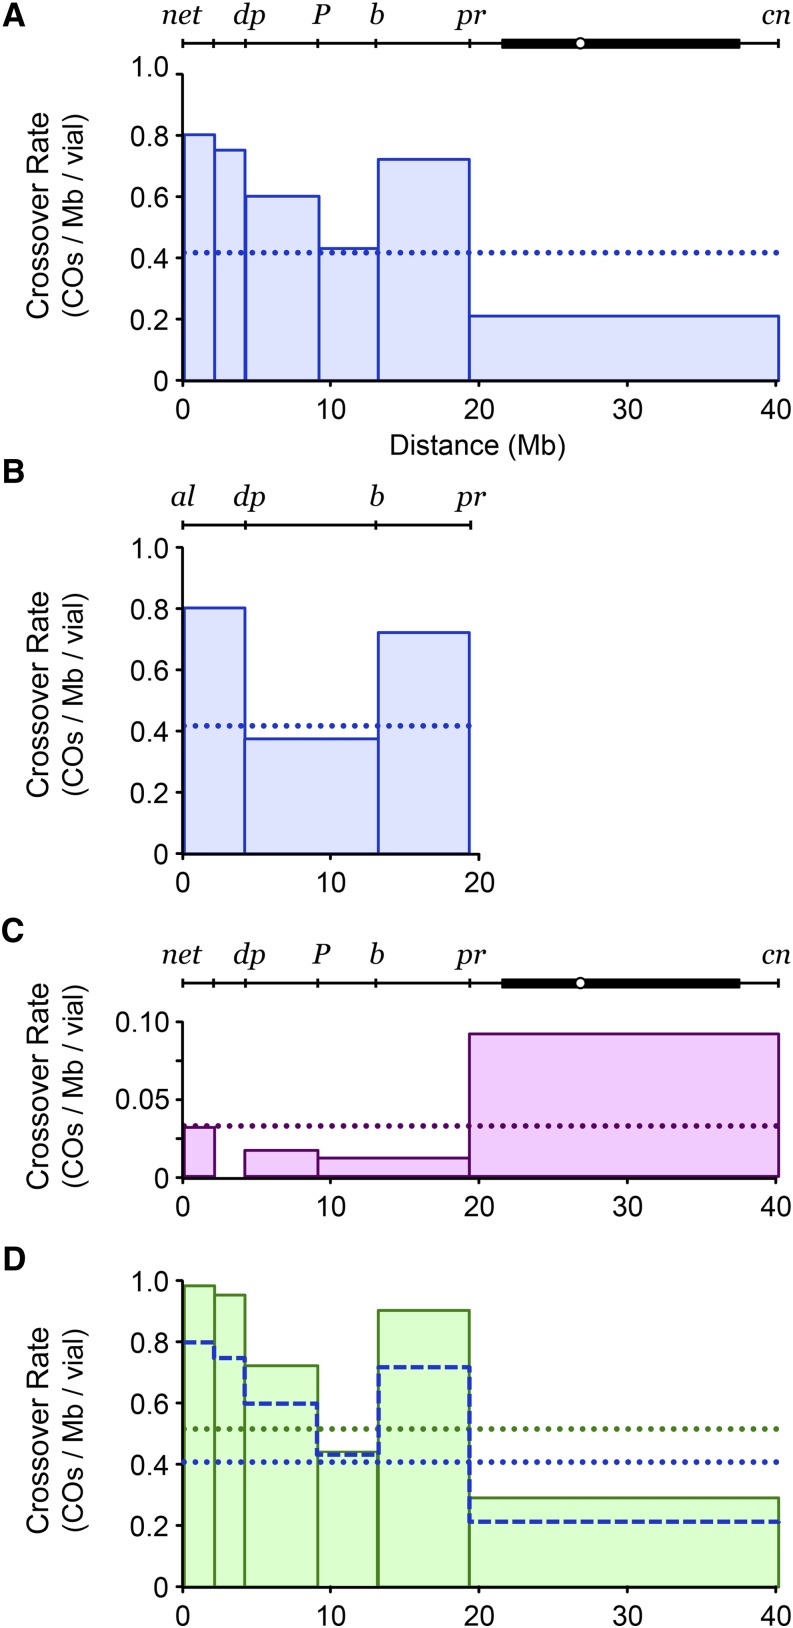
Figure 2.
Mitotic crossover distribution on chromosome 2L. (A) Distribution in Blm mutant males (532 crossovers from 313 males). The drawing at the top depicts the region assayed. Circle, centromere; thick line, pericentric heterochromatin. Bars indicate the crossover frequency in each interval. The dotted line shows the mean frequency across the entire region. Scale is in millions of base pairs (Mbp) from the left end of 2L. (B) Distribution in Blm mutant males (634 crossovers from 391 males) using a different set of chromosome 2 markers. (C) Distribution of mitotic crossovers in the female germline (12 crossovers from 13 vials). Note the different scale than in other panels. (D) Distribution in Blm mutant males (334 crossovers from 157 males) that are heterozygous for a DNApolα-180 mutation. The superimposed dashed blue line is the distribution from A.

