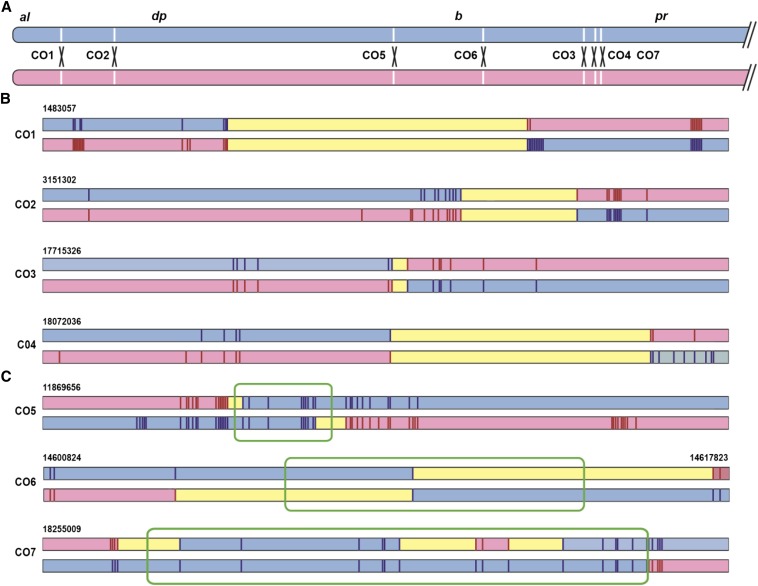
Figure 4.
Structures of reciprocal mitotic crossover products. (A) The euchromatic left arm of chromosome 2 is depicted with the locations of crossovers analyzed at the sequence level. The marker chromosome is blue and the reference chromosome is pink. (B) Molecular structures of reciprocal crossover products in which gene conversion tracts were not detected. Each line represents a 10-kb region surrounding the crossover site. Regions inferred to be derived from the marker chromosome are shaded in blue and those from the reference chromosome in pink. Yellow segments represent regions within which the chromosomal origin cannot be determined; exchanges occurred with these regions. Vertical lines indicate polymorphisms that were definitively genotyped. In some cases, DNA samples were exhausted before all polymorphisms could be genotyped on both products. (C) Molecular structures of reciprocal crossover products with evidence for associated gene conversion tracts. Colors are as in B. Green boxes indicate regions of gene conversion. Note that for CO6, the region included is 17 kb instead of 10 kb as in all other cases in panels B and C.

