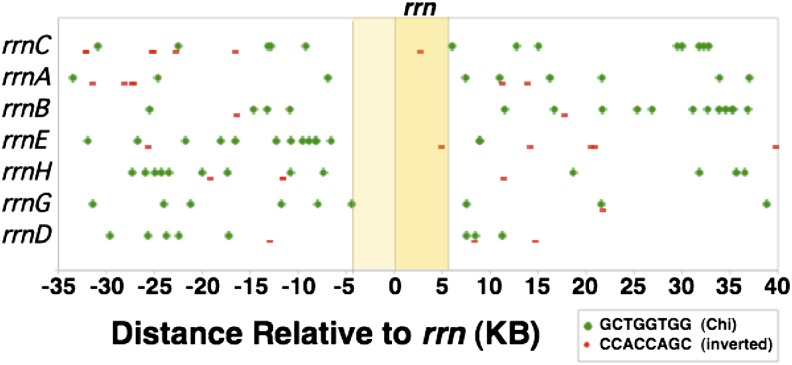
Figure 10.
Distribution of Chi sites in and near rrn loci. The seven rrn sequences (5.5 kb) are aligned with each other, leaving 35 kb of sequences on either side of rrn that are completely different for each locus. In the diagram, large green dots indicate Chi sequences oriented to activate a RecBCD enzyme moving toward the replication origin (right to left). Smaller red bars indicate Chi sequences in the opposite orientation.

