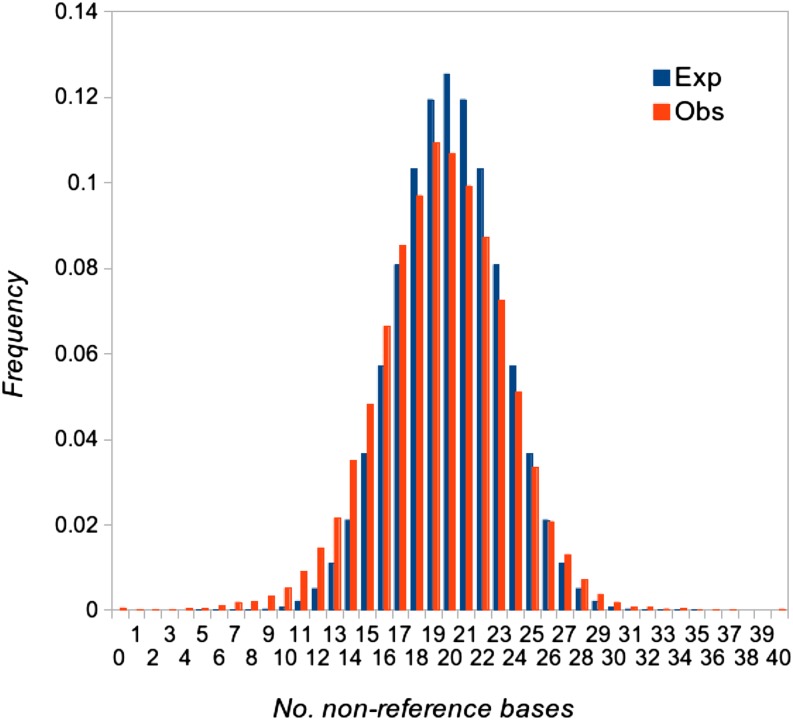
Figure 2.
Empirical (red) and expected (blue) distributions of the number of nonreference bases at heterozygous sites for offspring having read depths of 40. The empirical distribution shows the relative frequencies of sites having numbers of nonreference bases from 0 to 40. The expected distribution is binomial for equal frequencies of reference and nonreference bases.

