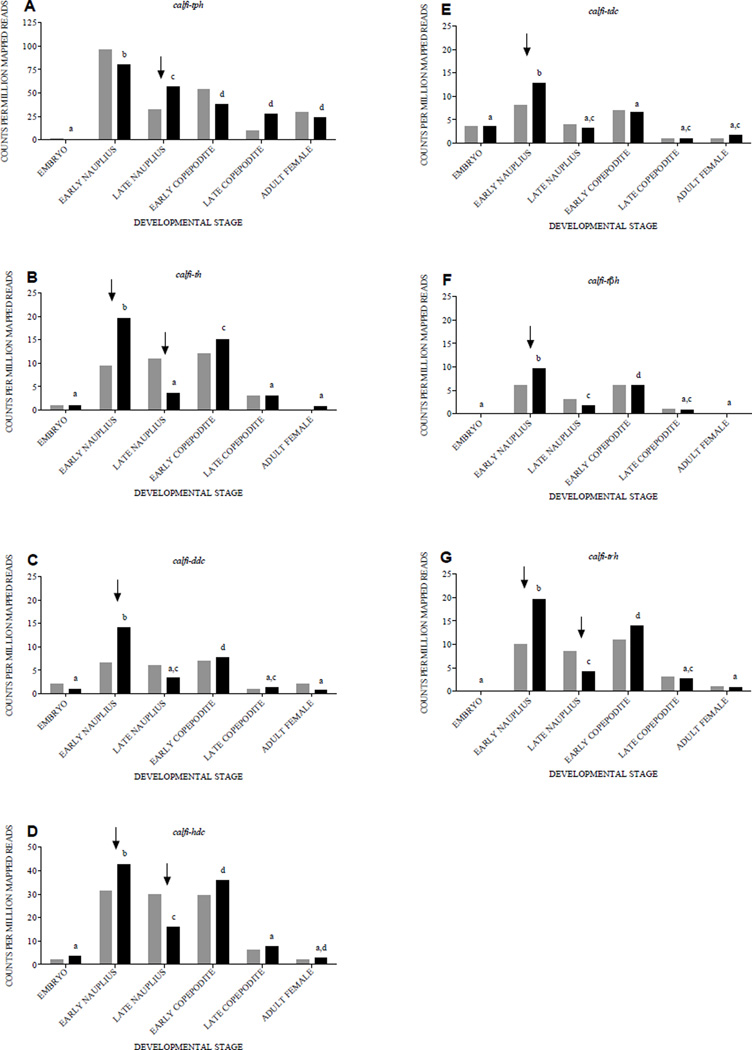
Figure 4.
Expression patterns of amine biosynthetic enzyme-encoding transcripts across six Calanus finmarchicus developmental stages in material collected in 2011 (grey bars) and 2012 (black bars) based on RNA-Seq data. Expression levels are presented as normalized counts per million reads that mapped to each target transcript sequence in embryo, early nauplius (stages NI-II), late nauplius (stages NV-NVI), early copepodite (stages CI-II), late copepodite (stage CV) and adult female (stage CVI). (A) calanus finmarchicus tryptophan-phenylalanine hydroxylase (calfi-tph). (B) calanus finmarchicus tyrosine hydroxylase (calfi-th). (C) calanus finmarchicus dopa decarboxylase (calfi-ddc). (D) calanus finmarchicus histidine decarboxylase (calfi-hdc). (E) calanus finmarchicus tyrosine decarboxylase (calfi-tdc). (F) calanus finmarchicus tyramine β-hydroxylase (calfi-tβh). (G) calanus finmarchicus tryptophan hydroxylase (calfi-trh). Significant differences in stage-specific expression between years are indicated by arrows. Significant differences among stages are indicated by small letters over the black bars (2012): the same letter indicates that two or more stages have similar expression levels (p-values given in Supplemental Fig. 3).

