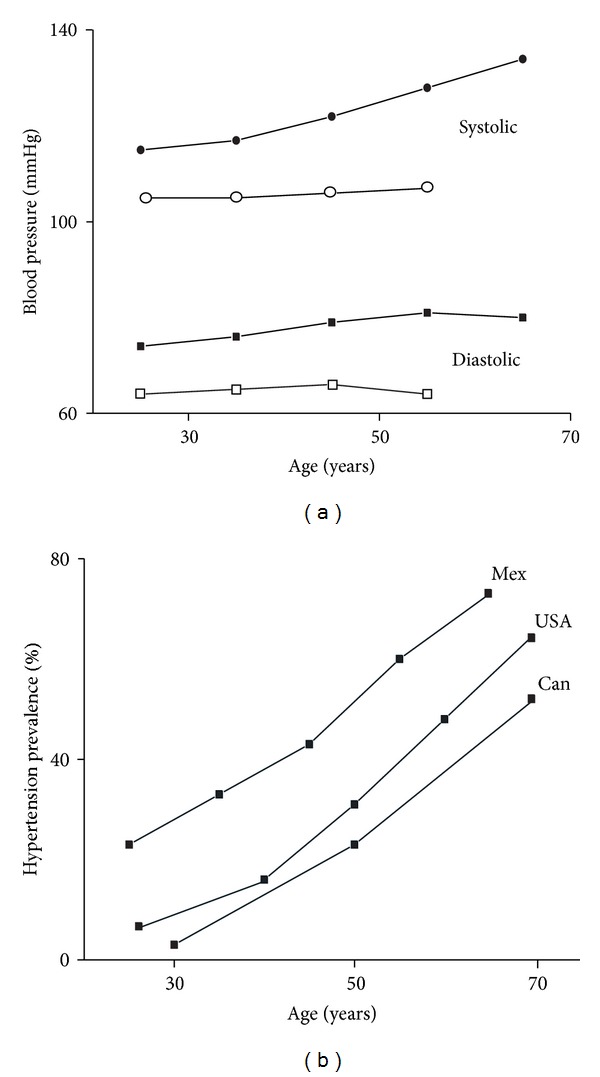
Figure 2.

Blood pressure and hypertension during the adulthood. (a) Systolic and diastolic blood pressure mean values (represented in 10-year age group intervals) as a function of age in nonacculturated populations (which do not add salt to food, open symbols) and in an acculturated (the Mexican) population (which does add salt to food, closed symbols). Data adapted from [3, 16]. (b) Hypertension prevalence as a function of age in the populations from Mexico (Mex), the United States of America (USA, both represented in 10-year age group intervals, with the exception of the first point of the USA graph, which represents a 17-year group interval), and Canada (Can, represented in 20-year age group intervals). Data adapted from [3, 17, 18].
