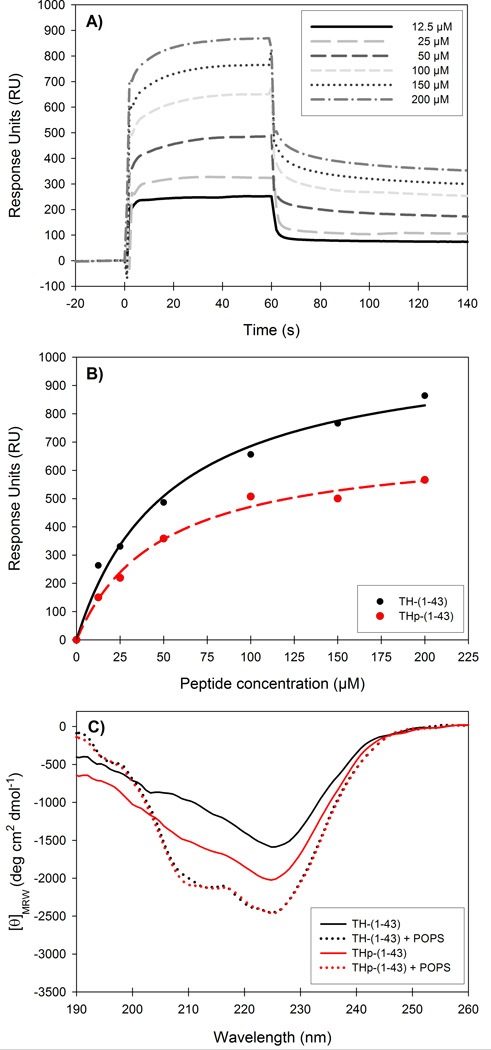
Figure 5. Binding of TH-(1-43) and THp-(1-43) to POPS liposomes by surface plasmon resonance and circular dichroism.
A) Representative sensorgrams for the interaction of TH-(1-43) with POPS liposomes on a L1 sensor chip at increasing concentrations of peptide. B) Peptide concentration dependency of TH-(1-43) (black) and THp-(1-43) (red) when bound to POPS liposomes. RUs were measured as a function of peptide concentration. S0.5 values were extracted from the hyperbolic, single-rectangular, two-parameter curve fitting and resulted in S0.5 of 53.3 ± 9.2 µM and 48.2 ± 7.4 µM for TH-(1-43) and THp-(1-43), respectively. C) Far-UV CD spectra of 40 µM TH-(1-43) (black lines) or THp-(1-43) (red lines) without (solid lines) or with (dotted lines) POPS liposomes (0.6 mM phospholipid). Samples were prepared in 10 mM Na-Hepes, 150 mM NaCl, pH 7.4, and spectra were recorded at 25 °C.

